Solutions · Finance
iGaming financial analytics.
Explain the number. And the gap.
Shared definitions. A clearer financial review.
Bring revenue, incentives, payment records and relevant costs into the same analysis. Understand why totals differ, examine actual performance against plan and prepare management reports with clear definitions, source coverage and reporting cut-offs.
The finance view
A consistent analytical basis.
Room to investigate the exceptions.
Financial analytics for iGaming connects operational and financial records to explain revenue, costs and performance. Gamblitude provides governed Metrics, detailed analysis, Targets and Reports over a shared data foundation. It helps finance investigate the figures and prepare management reporting; the general ledger, accounting approvals and statutory decisions stay in the systems and processes responsible for them. A useful shared model makes differences easier to understand rather than assuming they cannot occur.
Make definitions part of the number.
Agree which events, statuses, deductions and dates belong in each Metric. Keep operational GGR, your NGR definition, cash movements and accounting figures distinct when they serve different purposes. The same label on two exports is not evidence that they use the same settlement logic, currency conversion or reporting cut-off.
Investigate the cost and timing drivers.
Follow a revenue or margin variance into the underlying product, market, incentive and payment context. Inspect whether the change reflects activity volume, mix, unit costs or the timing of records. Master Chart and detailed data exploration let finance narrow the explanation before asking an operational owner to respond.
Keep the management pack traceable.
Use shared Metrics and Reports so charts and commentary start from a consistent analytical basis. Record the scope and cut-off used for the pack, review the explanation and retain the approved output in your reporting process. Targets keeps the selected plan or scenario alongside actual results without turning every assumption into a forecast.
Inside the platform
A shared starting point for the financial review.
Build Dashboards around agreed financial Metrics. Compare the same reporting windows and follow an unexpected result into its source data.
Explore the BI platform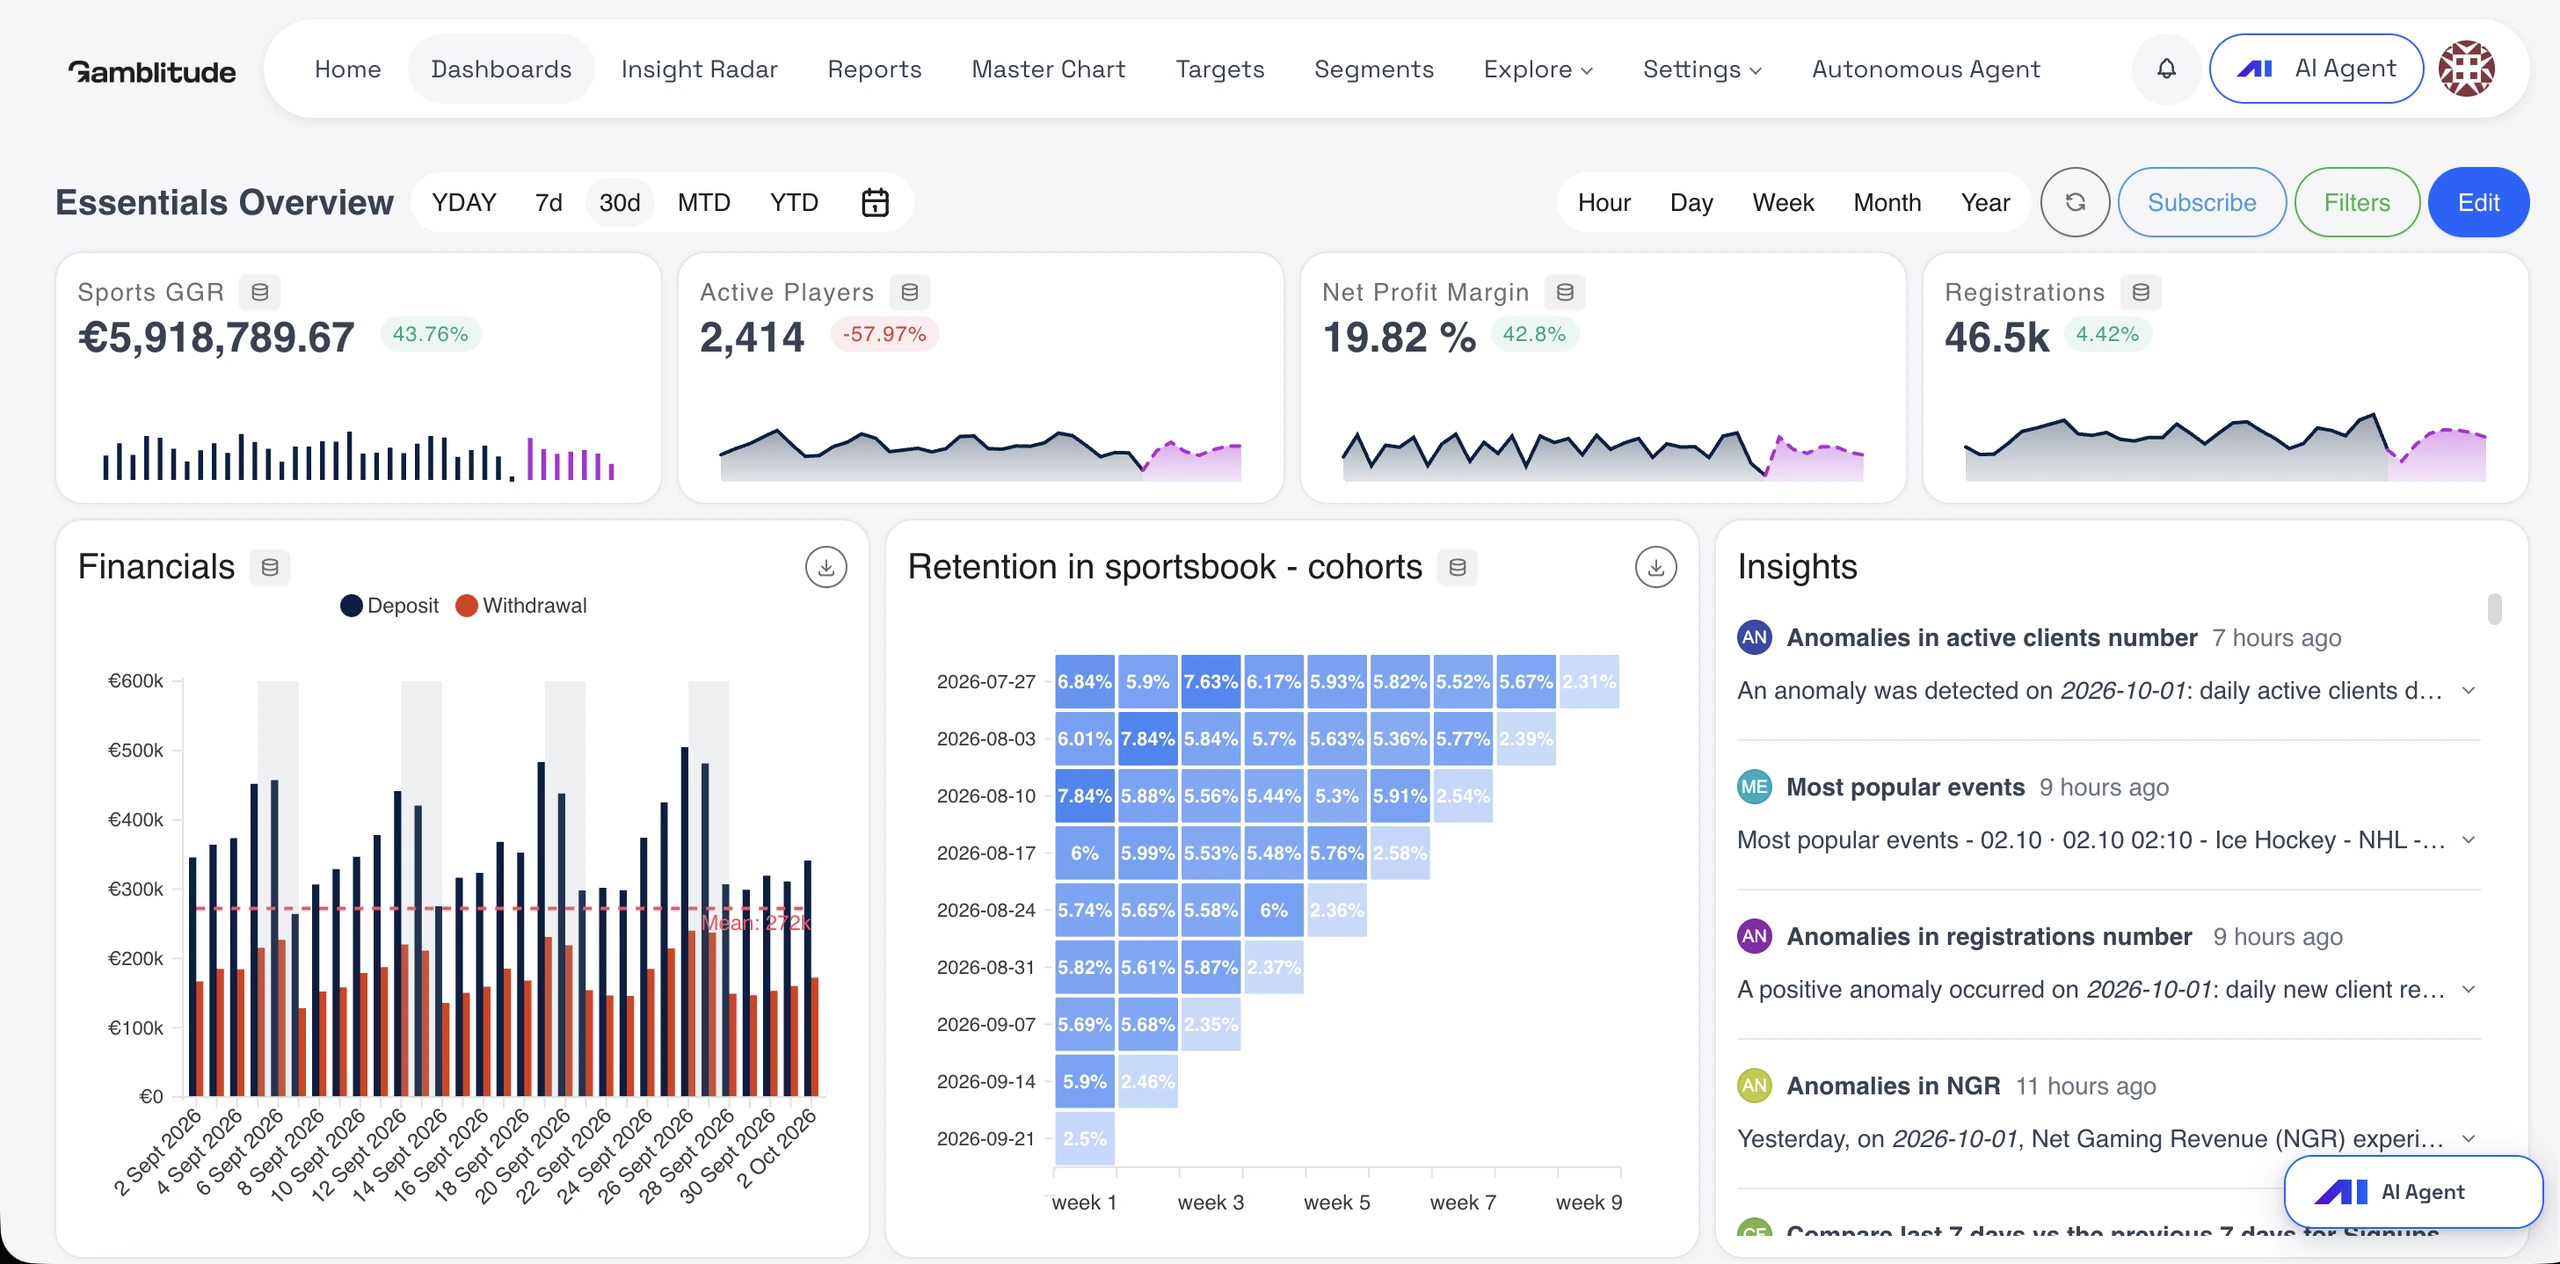
Four practical examples
From the first question
to a useful next step.
Explore the analysis, the comparisons and the context behind a decision. These are illustrative workflows, not customer results or preconfigured reports.
01 / Payment reconciliation
Successful deposits and net settlement answer different questions.
Does the gap reflect missing records, timing or legitimate deductions?
Successful deposits exceed the PSP’s net settlement figure. Align the reporting basis and inspect the bridge from gross activity to settlement before treating the gap as missing money.
- Compare the same currency, payment scope and relevant dates. Separate transaction success, settlement status and settlement date.
- Inspect pending settlement, recorded fees and other adjustments using available transaction identifiers. Keep unresolved records visible rather than forcing a match.
- Review the explanation with payments and finance. Use the existing reconciliation process to approve the treatment and investigate remaining exceptions.
Identify the records and timing differences that require action, while preserving the distinction between player deposits and cash settled by the provider.
02 / Revenue and deductions
The revenue line is stable. The net result is not.
Which included deductions explain the movement in the management NGR measure?
GGR is unchanged but the net measure falls. Separate the deduction categories before attributing the whole movement to product margin.
- Confirm the NGR definition and included costs. Avoid subtracting incentives or partner costs twice.
- Compare deductions by brand, market and period. Inspect incentives, acquisition costs and payment fees where included.
- Review the largest drivers with their owners. Separate cost increases from timing differences or classification changes.
Explain the net movement and agree which cost or classification question needs follow-up.
03 / Chargeback review
A developing dispute cohort can change after the period ends.
Are we comparing payment cohorts at the same age?
A recent payment cohort has fewer chargebacks than an older one. That may reflect dispute timing rather than a safer method or better provider performance.
- Define the payment cohort and counted dispute status. Preserve transaction and dispute dates.
- Compare equally mature windows by method, provider or market. Keep counts, amounts, fees and eventual recoveries distinct.
- Review records with payments or risk colleagues. Add status context before interpreting an unusual pattern as fraud or provider failure.
Choose a comparable basis for the review and follow the records that need investigation.
04 / Budget variance
Fees are over budget. The effective rate is lower.
Did cost rise because volume increased or because processing became more expensive?
Payment fees exceed plan. Check whether the business processed more value, paid a different effective rate or changed its provider and method mix.
- Compare processed value and fees with the same monthly Target scenario. Confirm complete cost coverage.
- Calculate fees against the agreed denominator. Compare provider, method and currency where available.
- Review fixed and variable charges, transaction sizes and mix before judging the movement. Record the explanation for management.
Discuss the fee variance in the context of business volume and composition instead of treating every overspend as a pricing problem.
Agree the definitions
Financial measures with an explicit basis.
Define the purpose, source treatment and reporting window before reusing a Metric across teams. A management measure can be useful without being identical to a statutory or ledger measure.
GGR
An agreed gross gaming revenue calculation for the relevant product, including settlement, void and reversal treatment.
Compare operating revenue on a consistent basis before examining deductions or cash movements.
NGR or defined net revenue
The chosen gross measure less explicitly identified deductions, following the operator’s management definition.
Explain the contribution of incentives, partner costs or other included categories without assuming a universal formula.
Incentive cost
The financial cost measure assigned to bonuses or promotions, with status and revenue treatment agreed.
Compare campaign economics without treating the nominal award, redeemed value and recognised cost as interchangeable.
Payment fee ratio
Included recorded payment fees divided by the agreed processed-value base for the period.
Review effective cost alongside volume, method mix and transaction sizes; it is not automatically the contractual fee rate.
Chargeback measures
Counts, amounts and costs tied to defined transaction cohorts, dispute statuses and observation windows.
Avoid comparing an immature cohort with a completed one or treating every dispute as a final loss.
Variance to Target
Actual result minus the chosen plan or scenario, with absolute and percentage measures where appropriate.
Separate volume, mix and cost questions before assigning a business explanation to a favourable or adverse variance.
Make it part of the week
A finance review that keeps the evidence with the explanation.
Start with one reporting or reconciliation question, establish its definitions and preserve the information needed to explain exceptions. Build the recurring routine from that basis.
Agree purpose and definitions.
Identify the management question and the systems responsible for the underlying records. Define settlement rules, currencies, deductions and cut-offs with finance and data owners. Decide where the analytical measure should match another system and where a difference is expected because the reporting purpose differs.
Connect and validate the records.
Bring the agreed operational, payment and financial inputs into the warehouse. Review identifiers, status changes, late-arriving records and source completeness. Use relevant samples and totals to assess whether the analytical view represents the intended scope before distributing it as a recurring report.
Investigate and prepare.
Use dashboards for the overview, Master Chart for comparisons and detailed records for exceptions. Ask AI Agent for an initial variance analysis grounded in the chosen Metrics. Review its explanation and use Reports to combine the figures, charts and commentary for management.
Approve and revisit.
Your finance process approves the report, accounting treatment and any operational response. Preserve the relevant cut-off and exported output in that process. Schedule a recurring Insight Radar check for the selected question, and revisit material exceptions or source changes in the next reporting cycle.
Subscribe to Dashboards, download PDFs and deliver configured reports or notifications to email, Slack, Telegram, Google Chat or Microsoft Teams. Keep the review in the tools your team already uses.
Choose how the analysis starts
Ask. Keep checking.
Discover what deserves a closer look.
The same governed data supports different ways of working. Your team reviews the evidence and decides what happens next.
You ask
AI Agent
Investigate a financial variance through the shared Metrics and connected records. Ask for a breakdown and comparison, then check the definition and source context behind the explanation before using it in a finance review.
Explain the month-on-month change in our management NGR measure by brand. Show GGR and each included deduction separately, using the same period and currency treatment.Explore AI Agent
You define the check
Insight Radar
Repeat a finance question on a chosen schedule. Specify the scope, period and comparison so the findings support your reporting routine rather than implying a universal reconciliation or close control.
Every week, compare recorded payment fees and processed value by provider, using complete source periods. Highlight changes in the effective fee ratio and any coverage gaps.Explore Insight Radar
It investigates
Autonomous Agent
Receive investigations the agent initiates across connected performance data. A discovery can identify an unexpected cost or revenue relationship for finance to assess with the relevant operating team.
Example investigation: a higher payment-cost share coincides with a shift toward one method in a market. Finance reviews mix, fees and record completeness before drawing a conclusion.Explore Autonomous Agent
Connect the right context
Connect financial context without losing the source meaning.
The analytical model should preserve identifiers, statuses and dates that explain differences. Scope integrations around the reporting purpose and the systems your finance team already uses.
Sources to bring together
- Sportsbook settlement and casino activity records
- Player payment transactions and PSP settlement reports
- Bonus and incentive records with agreed cost treatment
- Affiliate and acquisition cost inputs
- Finance-approved adjustments, tax or duty inputs where required
- Approved Targets, scenarios and reporting assumptions
Checks that make the analysis useful
- Keep transaction, settlement and adjustment dates distinct.
- Document currency conversion and the basis of each deduction.
- Review completeness, duplicates, reversals and late-arriving records.
- Apply role and dataset permissions to sensitive financial and player information.
Before you begin
Practical questions.
Clear answers.
What finance teams need to know about the data, the workflow and the available tools.
What is iGaming financial analytics?
It combines relevant operational and financial data to explain revenue, costs, variances and reporting differences. Gamblitude supports this through a managed data foundation, governed Metrics, dashboards, detailed analysis, Targets, Reports and AI. Finance defines the reporting purpose and reviews how the analytical measures relate to approved financial records.
Does Gamblitude replace our general ledger or close process?
No. It is an analytical platform, not the system that posts journals or approves the accounts. It can make supporting data, comparisons and exceptions easier to examine. Ledger entries, reconciliation sign-off, accounting policy and statutory reporting remain with your finance systems and authorised processes.
Can we define our own NGR calculation?
Metrics supports governed calculations and filters. Agree the gross base, deductions, exclusions, dates and currency treatment with the relevant owners, then reuse that definition in analysis and reporting. If finance and operations need different measures, name and explain them clearly rather than presenting two purposes under one ambiguous label.
Will shared definitions make every system reconcile automatically?
Shared definitions remove one source of ambiguity, but source timing, identifiers, statuses and adjustments still matter. The platform supports investigation of the available records and differences. Agree reconciliation requirements and review unresolved items through your existing process instead of assuming that matching labels guarantee matching totals.
How can finance assess whether a bonus paid back?
Connect the agreed incentive cost with campaign assignment, exposure and the relevant outcome window. Observed revenue after an offer is not automatically caused by the offer. To assess incremental return, use a credible comparison design and avoid counting costs twice if they are already included in the chosen net-revenue measure.
Can we include tax and duty figures?
Where required, finance-approved tax or duty inputs and their agreed analytical treatment can form part of the data scope. The responsible team supplies and validates the applicable rules, classifications and amounts. Gamblitude is not a source of tax advice or a promise of automated jurisdiction-by-jurisdiction liability calculation.
Does the platform forecast our P&L?
Targets can organise plans and scenarios alongside actual performance. Predictive Models are separately scoped and quoted. The published Player GGR Prediction estimates next-30-day GGR for eligible sportsbook players, not group NGR, tax, payment costs or a complete P&L. Discuss broader forecasting requirements as a distinct use case.
How do we prepare and share management reports?
Reports combines charts, analysis and commentary; your team can build a report or brief AI to draft it. Review the figures and source cut-off before sharing in the platform, exporting a PDF or using supported delivery channels. The approved output and any later restatement follow your own reporting controls.
See it with your team
Bring the difference you need to explain.
Start with its underlying records.
We will demonstrate a finance investigation using demo data, then discuss your source systems, reporting definitions, cut-offs and the questions that take the most effort to resolve.