Solutions · Executive
Executive iGaming analytics.
See what needs a decision.
One view of performance. The context to lead.
Bring revenue, acquisition, player activity and operational performance into the same leadership conversation. Start with governed KPIs, follow the changes that matter and give the right team a clear question to investigate.
The executive view
Know the number.
Understand the movement.
Executive analytics for iGaming connects business performance across brands, markets and products. A useful overview does more than display totals: it shows the definition, comparison period and contributing areas behind a change. Gamblitude brings dashboards, Targets, detailed analysis and AI onto one governed data foundation, so leadership can move from an overall result to a focused conversation with finance, acquisition, CRM or operations.
Agree the basis of the review.
Use shared Metrics for revenue, margin, activity and acquisition. Keep reporting periods, product scope, currency treatment and source freshness visible. Teams can bring different questions to the meeting while working from the same calculation, instead of discovering halfway through that one view includes unsettled bets or a different set of bonus deductions.
Find the change inside the total.
A strong group result can conceal a weak market. Higher deposits can sit beside lower contribution. Compare the headline with its brand, product, channel and cohort breakdowns before changing the plan. Master Chart and the AI Agent help leadership frame a sharper follow-up rather than interpreting a single KPI in isolation.
Turn the finding into an owned decision.
Use Reports to assemble the supporting numbers and commentary, and Targets to keep actual performance beside the plan. Assign the business response to the team that controls it. A useful leadership review ends with a decision, an owner and a way to revisit the result, not just another slide of unexplained movement.
Inside the platform
One overview. Many starting points.
Dashboards bring KPIs and their reporting periods together. Use the overview to choose a question, then explore the underlying comparisons.
Explore the BI platform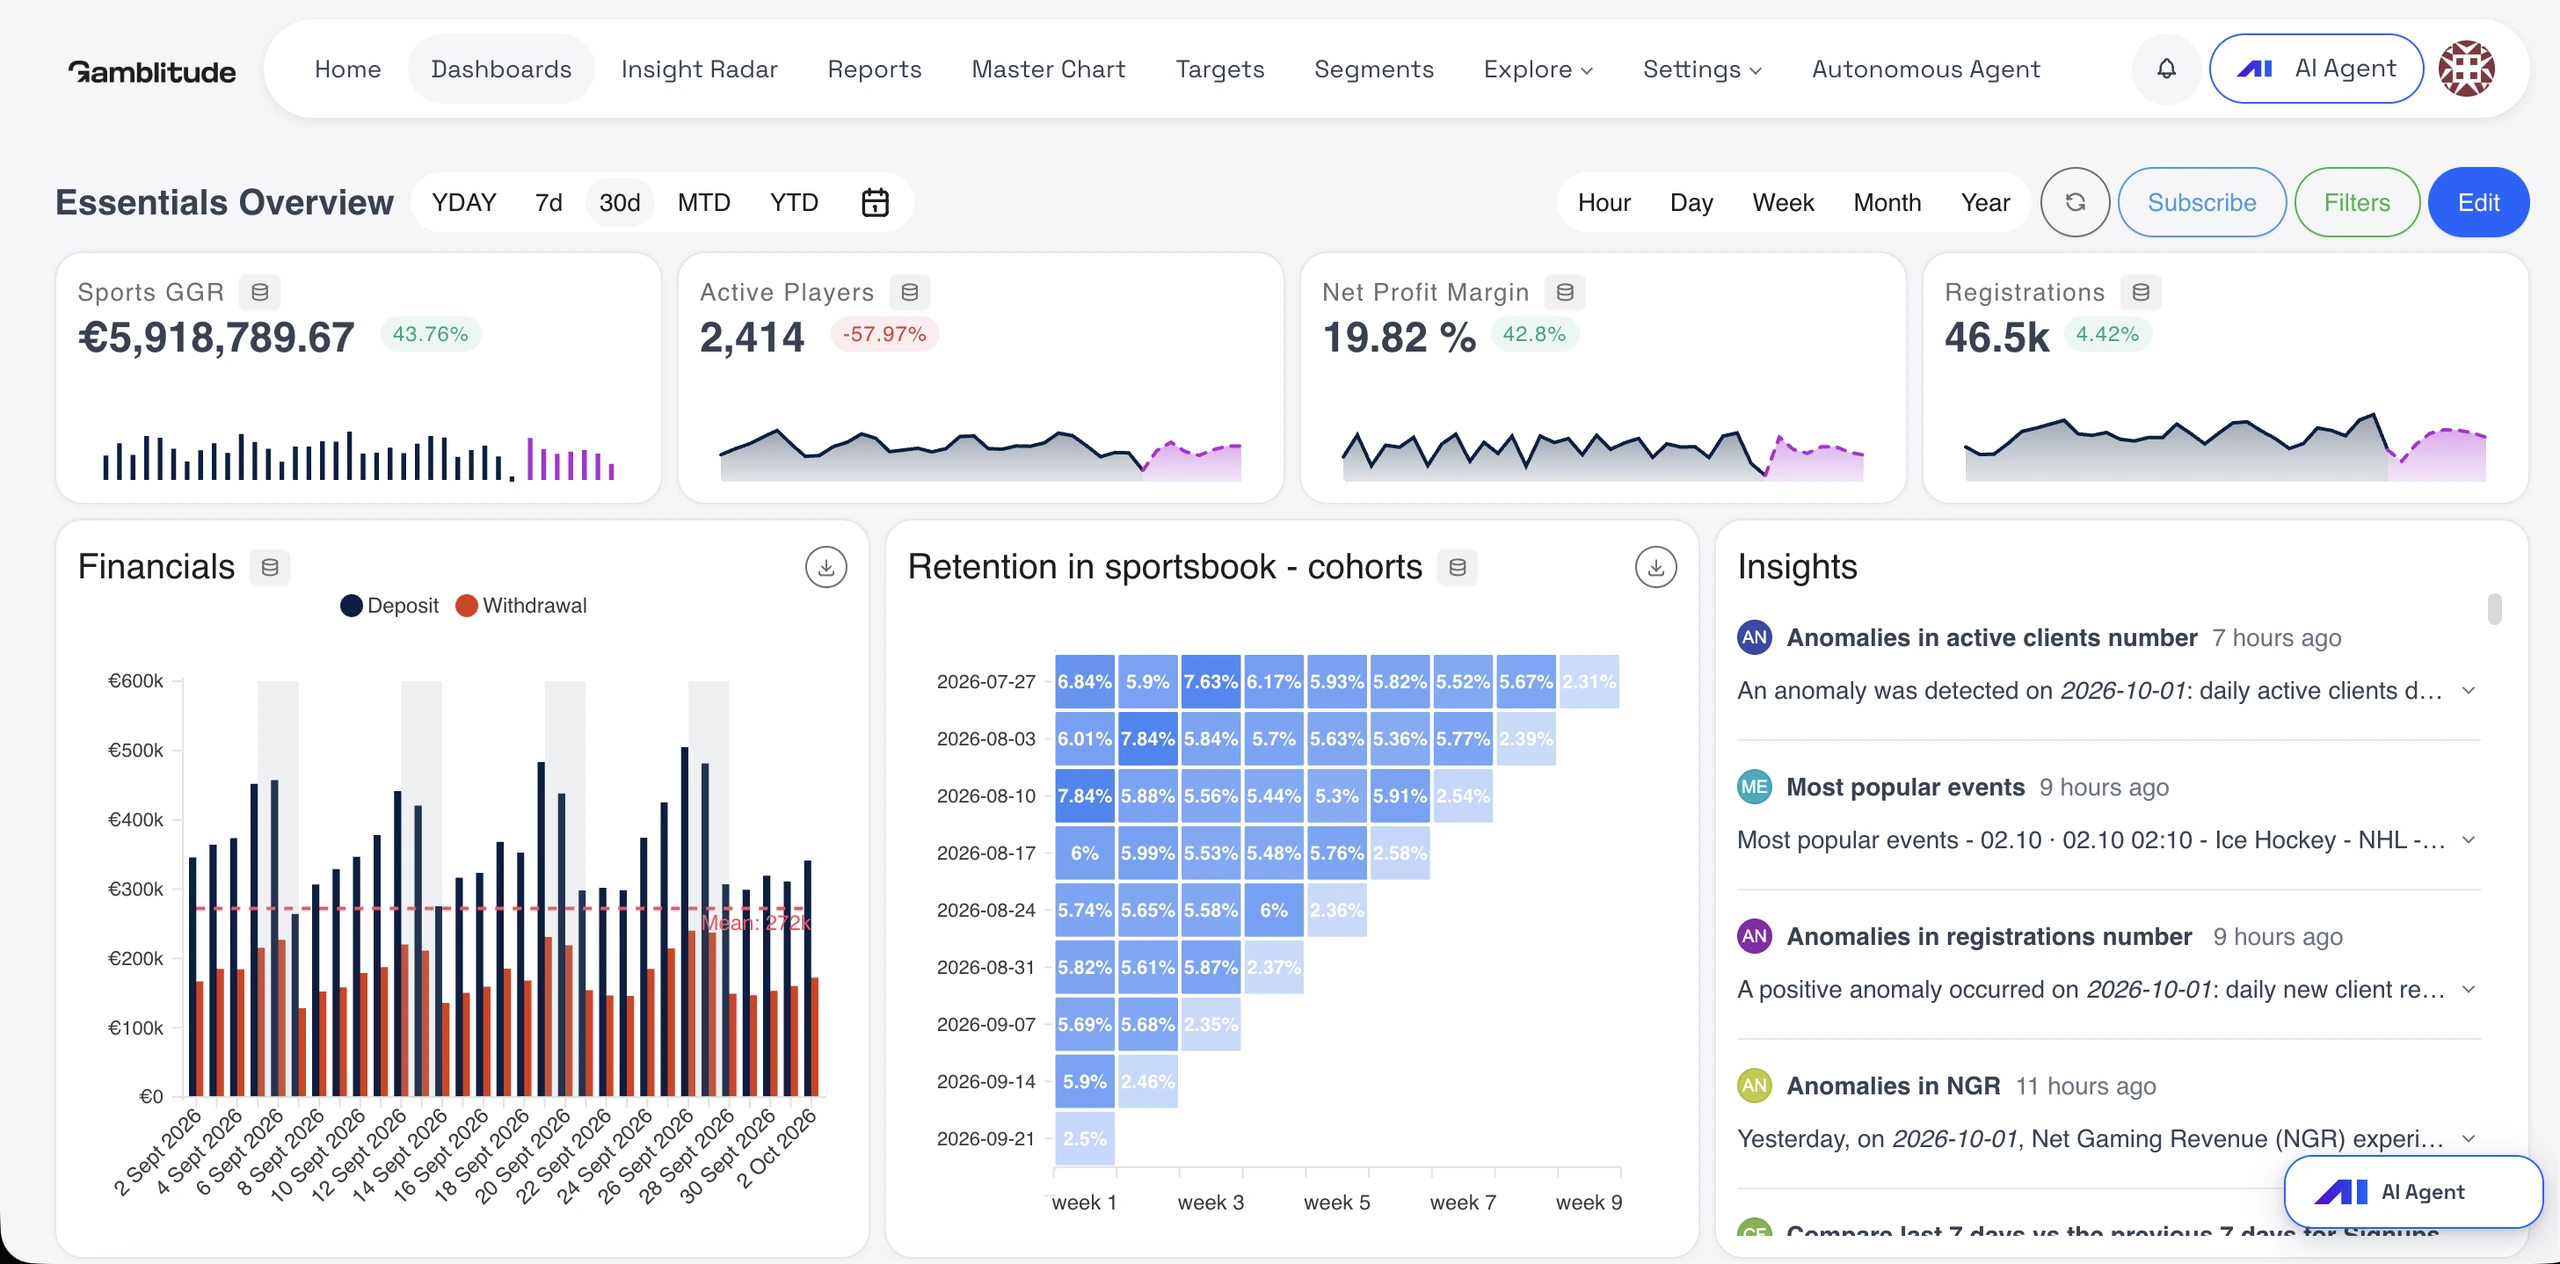
Four practical examples
From the first question
to a useful next step.
Explore the analysis, the comparisons and the context behind a decision. These are illustrative workflows, not customer results or preconfigured reports.
01 / Revenue review
GGR increased. Why did NGR fall?
Did trading performance improve while deductions absorbed the gain?
GGR increased, yet leadership sees lower NGR. Separate the revenue movement from the deductions in your agreed definition before treating this as a reporting error.
- Compare equal periods and confirm source coverage, settlement dates and currency treatment.
- Break GGR and deduction changes down by brand, vertical and market. Inspect the categories contributing most to the difference.
- Ask finance and the commercial owner to review the records, then document the explanation and proposed response in a Report.
Decide whether the change calls for a commercial review, a data correction or simply a clearer explanation of the month.
02 / Performance against plan
The group is ahead. One brand is behind.
Which part of the operation needs attention despite a positive headline?
The group exceeds its monthly revenue Target while one brand falls short. Leadership needs both views before increasing investment, revising assumptions or requesting a recovery plan.
- Compare brands with their own Targets for the same month and scenario. Show absolute and percentage variance.
- For the weaker brand, examine active players, activity per player, product mix and revenue. Separate volume from revenue outcomes.
- Check whether the stronger brand’s result reflects recurring activity or an unusual period. Record questions for each owner.
Agree targeted follow-up for the weaker brand while keeping the group result in context.
03 / Operational context
A deposit decline may begin in the payment journey.
Are fewer players attempting to deposit, or are more attempts failing?
Deposits fall in a priority market while registrations stay stable. Connect these observations before attributing the change to marketing quality or weaker player demand.
- Compare successful deposits with available attempt records. Use a consistent definition and separate retries from distinct players.
- Break success rates down by provider, method, market and device. Check equivalent periods and changes in method mix.
- Ask operations to inspect the affected route and status records. Share the context with acquisition and CRM.
Direct the first investigation to the team that can test the suspected friction, while keeping alternative explanations open.
04 / Board and management reporting
Explain why two apparently correct totals differ.
Are we comparing the same period, scope and version of the data?
A board-pack draft and a dashboard show different monthly totals. One predates late-arriving source records. Leadership needs an explanation before approving the final management figure.
- Confirm definitions, filters, currency and time zone. Identify when the source data behind each total was available.
- Separate a restatement from scope or cut-off differences. Ask finance to confirm the figure approved for reporting.
- Present the agreed result in Reports. Keep the exported PDF and relevant cut-off information together in your reporting process.
Publish the approved management figure with an explanation of material changes, and keep the operational view useful for ongoing monitoring.
Agree the definitions
A leadership scorecard with a shared meaning.
Choose a small set of Metrics that connect operating activity with commercial performance. Review the definition and denominator before combining products or comparing teams.
GGR and NGR
Revenue measures with agreed settlement rules, exclusions and deductions for each relevant product.
Separate top-line movement from the costs and adjustments that change the net result.
Product margin
An agreed revenue-to-volume relationship, with a denominator appropriate to the vertical.
Compare performance within a meaningful product context instead of averaging unrelated ratios.
Active players
Distinct players meeting a stated activity condition within the reporting period.
Distinguish changes in the player base from changes in activity or revenue per player.
First-time depositors
Players making their first qualifying successful deposit under the agreed account and brand rules.
Connect acquisition volume to funded participation without treating every registration as equivalent.
Cohort retention
The share of a defined starting cohort meeting an activity condition in a later window.
Understand whether growth is supported by continuing participation or depends on replacing departing players.
Variance to Target
Actual performance minus the selected Target, shown in absolute terms and, where meaningful, as a percentage.
Keep plan assumptions visible and identify the brands or markets that explain the gap.
Make it part of the week
A leadership routine the rest of the business can follow.
Build a review around questions and ownership. The same approach can support a weekly operating meeting and a monthly board discussion without assuming they need identical detail.
Define the scorecard.
Agree the Metrics, owners, periods and Targets that belong in the review. Use a drag-and-drop dashboard for the overview, then retain the relevant product, market and brand breakdowns for follow-up. Document the definitions that could change how a result is interpreted.
Prepare the comparisons.
Compare the selected period with plan and a suitable historical baseline. Check source freshness before treating a difference as a business event. Put material exceptions into a Report with the supporting chart, the current explanation and the question that remains unresolved.
Discuss and assign.
Use AI Agent to explore follow-up questions during preparation or review. Take an Autonomous Agent discovery into the same process when it is relevant. The business owner decides the response; the analysis supplies context for that judgement.
Return to the outcome.
Review the agreed action in the next cycle. Compare the follow-up measures with the original question, and distinguish an observed improvement from a demonstrated effect of the intervention. Reports and dashboard subscriptions keep the recurring information accessible to the people responsible.
Subscribe to Dashboards, download PDFs and deliver configured reports or notifications to email, Slack, Telegram, Google Chat or Microsoft Teams. Keep the review in the tools your team already uses.
Choose how the analysis starts
Ask. Keep checking.
Discover what deserves a closer look.
The same governed data supports different ways of working. Your team reviews the evidence and decides what happens next.
You ask
AI Agent
Explore the question raised by the leadership overview. Ask for a breakdown, a comparison period or the supporting definition, then refine the investigation before deciding which team should take it forward.
Which brands and markets contributed most to the NGR change this month, and how do GGR and agreed deductions differ from last month?Explore AI Agent
You define the check
Insight Radar
Make a recurring leadership question part of the reporting routine. Set the scope and schedule, including the comparison your team wants, and review the findings alongside the underlying figures.
Every Monday, review last week’s revenue and active players by brand, compare the prior four weeks, and highlight material changes for the executive meeting.Explore Insight Radar
It investigates
Autonomous Agent
Receive investigations the agent selects from connected business data. A finding can connect a headline movement with a less obvious product or operational change. Review its evidence and continue with AI Agent when the thread is relevant.
Example investigation: an apparent acquisition slowdown is accompanied by a payment-method conversion decline in one market, suggesting a useful cross-team question.Explore Autonomous Agent
Connect the right context
An executive view is only as coherent as its inputs.
Connect the sources needed for your operating model, then align business meaning as well as identifiers. Leadership needs to know what is covered, how recent it is and which definitions are shared.
Sources to bring together
- Player accounts and activity records
- Sportsbook bets and casino game sessions
- Successful payments and attempt-level status records
- Acquisition, affiliate and CRM activity
- Approved business Targets and reporting assumptions
Checks that make the analysis useful
- Keep reporting time zones, settlement dates and cut-offs explicit.
- Separate currencies or apply the agreed conversion method consistently.
- Check completeness by source before comparing periods or markets.
- Keep access appropriate to the role and sensitivity of the underlying records.
Before you begin
Practical questions.
Clear answers.
What executive teams need to know about the data, the workflow and the available tools.
What is executive analytics for iGaming?
It is the use of connected business data to review performance and support leadership decisions across an iGaming operation. The most useful view combines financial and operating KPIs with the definitions, comparisons and breakdowns behind them. Gamblitude connects that overview to detailed analysis, Targets, Reports and AI investigations.
Can we combine brands, markets and products?
Yes, where the relevant sources and identifiers are connected. You can compare the combined business and its parts. Metric definitions still matter: sportsbook stakes, casino wagering and poker fees are different measures. Agree the aggregation and currency treatment before presenting a group result as directly comparable across products.
Can leadership use the platform without SQL?
Dashboards have a drag-and-drop editor, and Master Chart, Targets and Reports support everyday analytical work through visual tools. AI Agent accepts questions in plain language. The data team still has a role in source integration and the definitions behind more specialised calculations, while business users work from that shared foundation.
Does this replace finance reconciliation or accounting?
No. It gives leadership and finance shared analytical definitions and a way to investigate differences. Source cut-offs, late records and accounting policies still require review. Your finance process determines the approved management or statutory figure; a live analytical view may serve a different reporting purpose.
Can Gamblitude produce our management report?
Reports combines charts, analysis and commentary. Your team can create a report or brief AI to draft one, then review and share it in the platform, export a PDF or use supported delivery channels. Agree the reporting period and source cut-off so readers understand the basis of the figures.
Are business forecasts included automatically?
Targets supports plans and scenarios. Predictive Models are separately scoped and quoted for defined applications. The published Player GGR Prediction estimates the next 30 days of GGR for eligible sportsbook players; it is not a universal forecast of group NGR, tax or every product’s lifetime value. Wider forecasting needs a separate scope discussion.
How current will the overview be?
That depends on each source, delivery method and agreed processing schedule. Streaming and scheduled feeds can coexist. A useful executive overview makes the relevant coverage and reporting cut-off clear, particularly when one operational feed refreshes more frequently than campaign costs or finance adjustments.
Does Autonomous Agent make operating decisions?
It initiates and develops analytical investigations, then shares findings and context. Your team assesses the evidence, decides the response and carries out the business action. Autonomous Agent is included in standard BI pricing; a user-defined recurring executive check belongs in Insight Radar.
See it with your team
Bring the leadership question.
Follow it to the detail.
We will demonstrate the executive view and a focused investigation using demo data, then discuss your brands, sources, reporting priorities and the decisions your team needs to support.