Solutions · Casino Management
Know what is working
across your casino.
Give every portfolio decision the context behind the headline.
See which games attract play, how providers contribute, where observed returns change and what happens after a promotion. Gamblitude connects casino activity with player and campaign context, so your team can investigate the catalogue, compare launches fairly and build a clearer view of performance.
Understand the portfolio
A popular title.
A profitable portfolio?
Casino management analytics combines game, provider and player activity to explain the performance of an online casino catalogue. Stakes and GGR are a starting point. Placement, eligible audience, payout variation and promotion costs add the context needed to judge a result. Gamblitude gives casino managers shared definitions and self-serve analysis across these layers, so a launch review, provider discussion and campaign readout can draw on the same underlying records.
Understand each provider's contribution
Compare stakes, active players, observed RTP and GGR by provider, game and category. Inspect concentration and game mix before attributing a portfolio movement to a commercial or content decision.
Give content a fair comparison
Read launch performance against time since release, audience exposure and placement where those events are available. Separate a game that received more visibility from one that converted that visibility more effectively.
Connect promotions with subsequent activity
Bring offers, costs and later play into the same analysis. Understand the observed journey, then use a controlled comparison when the decision depends on how much additional activity the promotion caused.
Inside the platform
Follow a portfolio question into the detail.
Master Chart provides a workspace for comparing the Metrics and dimensions available in your connected casino data.
Explore the BI platform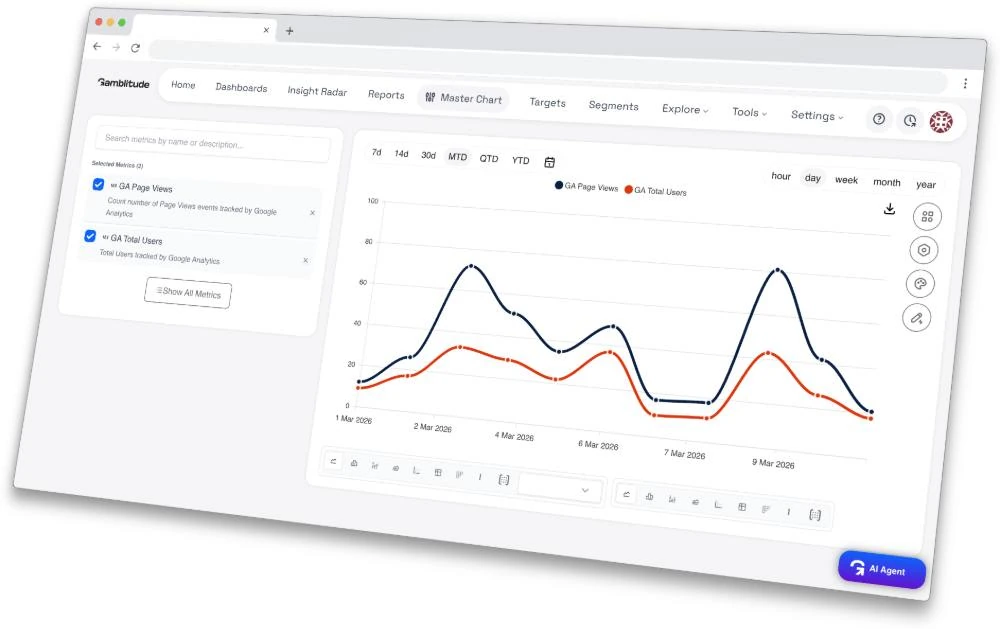
Four practical examples
From the first question
to a useful next step.
Explore the analysis, the comparisons and the context behind a decision. These are illustrative workflows, not customer results or preconfigured reports.
01 / Return and margin
A game is running hot. What should you investigate?
Is higher observed RTP a result fluctuation, a mix change or a data issue?
A title’s observed return rises above its configured theoretical RTP. A short sample or a few large wins can move the result without establishing a configuration fault.
- Use matched settled rounds, stake and payout records. Confirm the game version, currency, jackpot treatment and period before interpreting the ratio.
- Compare round counts, stake distribution and the largest payout contributions with a longer comparable history. Review any applicable source or configuration change.
- Investigate unusual records with the provider and technical teams, using the underlying round identifiers and reconciliation evidence.
Prioritise review without treating every deviation as a defective game or margin loss.
02 / New content
Compare launch appeal, not just launch visibility
Which new title turns the opportunity to discover it into actual play?
Two games launch together, but one receives a prominent homepage position. Its larger player count cannot establish stronger appeal when exposure differs.
- Compare equal launch windows and record eligible users actually exposed to each placement, where tracking supports it.
- Calculate first-play conversion from those exposed users. Inspect device, market and player tenure, then follow repeat play in a fixed subsequent window.
- Review portfolio activity alongside title adoption: players may switch between games, discover something additional, or simply follow a changed placement.
Choose a comparable placement test before treating adoption totals as superior performance.
03 / Promotion review
Measure the additional result after the offer
Did a reactivation offer generate enough additional value to cover its cost?
A campaign produces returning players and GGR. Some recipients would have returned anyway, so attributing the full result to the incentive overstates what the campaign achieved.
- Start from an operator-qualified audience and a valid randomised comparison, with the same observation window and agreed eligibility rules.
- Compare outcomes per assigned player, including non-responders. Reconcile bonus costs and other relevant costs instead of analysing only players who redeemed.
- Review uncertainty and later activity before changing policy. Keep player-protection exclusions separate from commercial analysis and apply them throughout the process.
Judge the measured additional result and its uncertainty, then decide whether another test or policy change is justified.
04 / Provider review
See where portfolio performance depends on a few titles
Is a provider's growth broad, or concentrated in one game?
A provider’s share of casino stakes increases. The commercial discussion changes if growth comes from a broad catalogue or one prominent title with few active players.
- Compare the provider's share of total casino stakes and GGR across matched periods, then open the title-level contribution.
- Inspect player reach, stake concentration and repeat play for the leading titles. Include catalogue availability and placement context where recorded.
- Compare the rest of the provider's catalogue with relevant categories, so a successful lead title does not conceal weakening performance elsewhere.
Use this portfolio picture in content rotation, provider discussions and placement plans.
Agree the definitions
Make game comparisons mean the same thing.
Use governed Metrics to agree which rounds, players, costs and time windows are included. Keep a title's popularity, realised outcome and longer-term engagement as related but distinct views.
Casino stakes
The value wagered on the agreed set of rounds, with cash and bonus-funded play treated explicitly.
Compare activity and portfolio shares while retaining the source and currency conventions behind the total.
Casino GGR
Stakes less associated payouts for the same round population, according to agreed settlement and jackpot treatment.
Trace realised revenue to providers and games without treating it as profit after every cost.
Observed RTP
Recorded payouts divided by corresponding stakes over a defined sample. Theoretical RTP is a separate configured long-run parameter.
Investigate variation alongside volume, payout distribution and configuration context rather than applying an arbitrary universal alarm threshold.
Discovery-to-play conversion
Distinct exposed users who play the title divided by distinct eligible exposed users, using a specified attribution window.
Compare the response to a placement when the necessary exposure and interaction events are captured.
Repeat play
The share of a fixed first-play cohort that returns to the title within an agreed later window.
Evaluate continued interest while allowing every member of the comparison cohort the same follow-up time.
Result after incentive costs
The agreed revenue measure less the incentive costs allocated to the same audience and period.
Review promotion economics; a valid control design is needed to estimate the additional result caused by the offer.
Make it part of the week
Turn the catalogue review into a working routine.
Start with the questions your casino manager, content team and commercial lead need to settle together. Build one repeatable review, then add the comparisons that make it more useful.
Align the catalogue and definitions
Map provider and game identifiers across activity feeds, metadata and placements. Reconcile a sample of rounds and agree the treatment of jackpots, corrections and bonus play.
Build a portfolio dashboard
Arrange drag-and-drop Dashboards around providers, titles, launches and player activity. Keep the review period visible and use Master Chart to explore the groups behind a total.
Follow up on the exceptions
Schedule recurring questions with Insight Radar: changing provider contribution, launch conversion or observed return. Review the supporting data before deciding which content or technical issue needs attention.
Test and review the next change
Take a placement or promotion proposal into the team's execution process. Define the comparison beforehand and use Reports to examine outcomes after the agreed observation window.
Subscribe to Dashboards, download PDFs and deliver configured reports or notifications to email, Slack, Telegram, Google Chat or Microsoft Teams. Keep the review in the tools your team already uses.
Choose how the analysis starts
Ask. Keep checking.
Discover what deserves a closer look.
The same governed data supports different ways of working. Your team reviews the evidence and decides what happens next.
You ask
AI Agent
Investigate a portfolio movement through a conversation. Ask for provider, title or cohort breakdowns, then examine the supporting numbers and alternative explanations.
Which games account for the change in casino GGR this week? Compare their stakes, observed RTP and share of portfolio activity.Explore AI Agent
You define the check
Insight Radar
Keep a defined casino investigation running on your chosen schedule. Set the scope and comparison window so findings fit the portfolio review.
Review new releases after their first seven complete days. Compare recorded exposure, first play and subsequent activity where those data are available.Explore Insight Radar
It investigates
Autonomous Agent
Let the agent choose and develop analytical threads across connected data. Review its findings as evidence for a follow-up, with your team retaining control of catalogue and campaign decisions.
A finding about a provider's changing contribution can open a deeper discussion about game mix, player activity and placement history.Explore Autonomous Agent
Connect the right context
Give each round its product context.
Game transactions explain realised activity. Catalogue, placement and campaign data explain the opportunities surrounding that activity. Connect the sources needed for the question rather than assuming that financial totals can reconstruct every interaction.
Sources to bring together
- Game rounds, stakes, payouts and settlement corrections with stable game and player identifiers.
- Provider and game catalogue metadata, including relevant versions, categories and configured parameters.
- Recorded lobby exposure, selection and launch events for placement and discovery analysis.
- Player and session context with available device, market, tenure and activity history.
- Bonus offers, assignments, usage and cost records, plus test allocation where a controlled comparison is planned.
Checks that make the analysis useful
- Map duplicated or renamed game identifiers so the same title is not fragmented across reports.
- Match stakes and payouts to the same round population and document jackpot and currency treatment.
- Distinguish content availability from actual exposure; missing impression tracking is not zero exposure.
- Compare complete launch and retention windows, with source freshness and late settlements visible.
Before you begin
Practical questions.
Clear answers.
What casino management teams need to know about the data, the workflow and the available tools.
What does casino management analytics cover?
It connects game and provider performance with player behaviour, discovery and promotion context. Casino managers can examine stakes, GGR, observed RTP, reach and repeat play, then investigate the titles or cohorts behind a change using shared definitions.
Can we compare providers and individual games?
Yes, where their identifiers and activity are connected. Master Chart can break down governed Metrics across available dimensions. Compare both contribution and rate measures: a provider can contribute more GGR because it receives more play without generating a higher hold.
Does an RTP deviation mean a game is configured incorrectly?
No. Observed RTP describes a finite sample, while configured theoretical RTP describes a long-run property. Volume, payout variation, game version and data treatment all matter. A deviation can prompt investigation, but does not by itself identify a configuration error.
How can we measure whether a lobby change worked?
Capture which eligible users saw each placement and what they did afterwards. Use a comparable controlled test when the goal is causal impact. If only before-and-after data are available, inspect audience and promotion changes and describe the result as observed performance.
Can Gamblitude recommend casino games to players?
Content Recommendations is a separately scoped implementation for ranking eligible games around a defined placement. The approach, catalogue rules, integration, refresh and evaluation are agreed with your team. Applying a ranking to the lobby is part of that agreed delivery scope.
Can we measure bonus profitability?
You can analyse agreed revenue and incentive costs for an audience and period. To estimate incremental benefit, compare valid treatment and control groups and include the relevant cost differences. Redemption and subsequent GGR alone do not establish that the offer generated an additional profit.
Is Bonus Value Optimisation included automatically?
It is individually scoped and quoted. Its published starting application recommends reactivation bonus amounts within an audience and offer mechanics already qualified by the operator. It does not replace audience eligibility, player-protection rules or the need for a controlled evaluation.
How quickly can casino changes appear in the platform?
The refresh depends on source availability, ingestion and processing arrangements. Agree the schedule for the intended decision and inspect late settlements or missing feeds before interpreting a movement. Different transaction, catalogue and interaction sources can have different update schedules.
See it with your team
Bring your next
portfolio question.
Choose a provider review, game launch or promotion you want to understand better. We will demonstrate the analysis with demo data and discuss the records, definitions and comparisons that would make it useful for your casino team.