Solutions · Product
Ship the change.
Understand what followed.
Product analytics that connects the player journey with the wider business.
Follow onboarding, feature discovery and repeat use alongside payments, game activity and acquisition context. Gamblitude brings available product and operational data into a shared analytical model, so your team can investigate releases, interpret experiments and decide which question to tackle next.
Learning after the release
The metric moved.
What does that tell you?
iGaming product analytics examines how players discover, use and return to a product, connecting those behaviours with operational outcomes. The useful question goes beyond whether a chart increased after release. Which users could see the change? Did they use it? What else changed in the audience or experience? Gamblitude helps product teams examine these relationships on governed Metrics, with the cohort, observation window and business context available for review.
Locate the friction in a journey
Compare defined funnel steps by device, market, acquisition cohort and release version. Link recorded behaviour with operational outcomes to distinguish a missing event, an incomplete process and a confirmed failure.
Understand adoption beyond the headline
Separate access to a feature, exposure, first use and repeat use. A growing click count can coexist with low reach or weak repeat engagement, so give each stage its own denominator.
Make experiment readouts comparable
Bring recorded assignment and outcomes together around agreed Metrics. Keep the original comparison groups and evaluation plan intact, then review uncertainty and guardrails before turning a numerical difference into a rollout decision.
Inside the platform
Understand which players experience the change.
Segments help product teams compare defined groups. Connect product events with player activity and business outcomes using consistent identity and time windows.
Explore the BI platform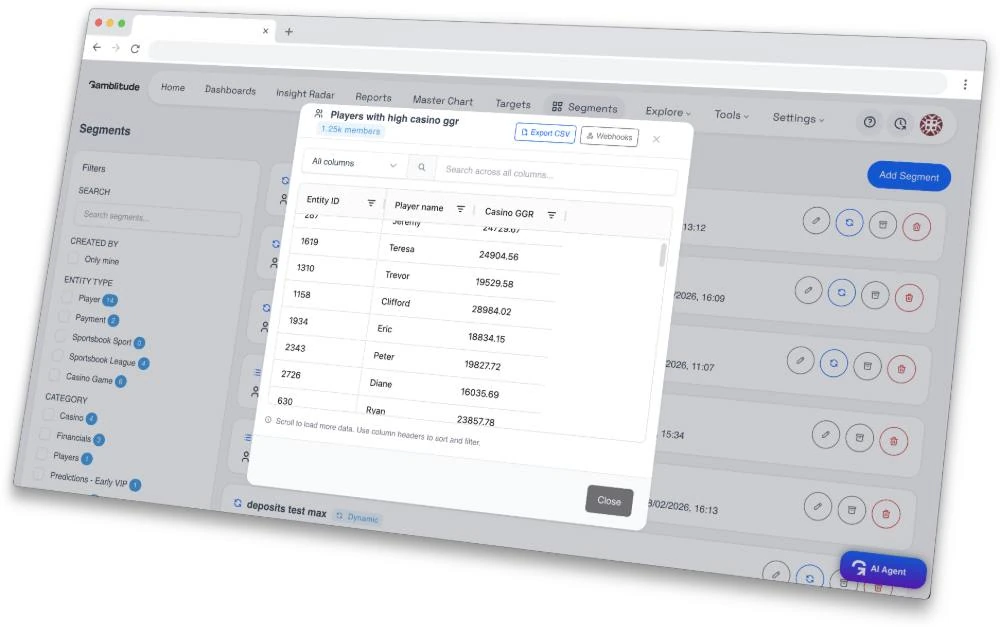
Four practical examples
From the first question
to a useful next step.
Explore the analysis, the comparisons and the context behind a decision. These are illustrative workflows, not customer results or preconfigured reports.
01 / Onboarding
Find the step behind a conversion decline
Where does the registration-to-first-deposit journey lose players?
First-deposit conversion falls despite steady registrations. The headline does not show whether the movement begins before verification, at payment entry or after submission.
- Define a registration cohort and a fixed completion window. Require the intended event order and allow each player the full follow-up period.
- Compare verified players, deposit attempters and successful first depositors by device and market, using unique players at each stage.
- Check product events against verification and payment records. Inspect missing events and technical outcomes before deciding which part of the experience needs work.
Give the product and operations teams a specific stage and cohort to investigate together.
02 / Feature adoption
Distinguish being eligible from actually seeing the feature
Is low adoption a discovery problem or a response to the experience?
A new feature is available to thousands of users, but only some encounter it. Combining eligibility and exposure into one adoption number hides where the opportunity to improve may sit.
- Create separate counts for eligible users, users with a recorded exposure and users completing the intended interaction, all within one defined window.
- Compare the stages by entry point, device and tenure. Check whether tracking covers the same experience across web and app versions.
- Follow repeat use in a fixed cohort. Higher retention among feature users may reflect who chose to use it.
Investigate visibility, interaction design or continued usefulness, then test the chosen change.
03 / Controlled experiments
Read the assigned groups before declaring a winner
Did the new experience improve the outcome we agreed to measure?
An experiment shows higher conversion for a new experience. Its readout needs valid assignment, complete follow-up and the evaluation rules agreed before launch.
- Check randomisation, allocation balance, stable assignment and event coverage. Keep users who did not engage in their assigned group for the primary comparison.
- Use the agreed primary metric, observation window and unit of analysis. Inspect guardrails such as errors or failed transactions alongside conversion.
- Assess statistical uncertainty and the planned stopping rule using the agreed analysis method. Treat exploratory subgroup findings as questions for further evaluation.
Decide on rollout, iteration or further observation from the complete readout, not the most favourable slice.
04 / Release investigation
Connect a product symptom with its operational context
Why did payment completion fall after a mobile release?
A release and a lower completion rate occur together. The timing suggests a useful investigation, but payment routing, audience mix or another service change may also explain the movement.
- Compare matched attempt definitions across versions, devices and payment methods. Inspect attempt counts as well as success rates.
- Join available product events with payment outcomes and error categories using stable identifiers. Review what happened between submission and confirmed completion.
- Check release exposure, provider incidents and acquisition changes. Reproduce the suspected issue with the responsible team before attributing it to the release.
Choose a focused investigation and agree how to check the fix.
Agree the definitions
Give every product metric a defined journey.
The event name is only part of the definition. Agree the population, identity rules, sequence and time window, then make those choices consistent across dashboards, release reviews and experiment reports.
Activation rate
The share of an eligible cohort completing an agreed meaningful first action within a specified period.
Judge the onboarding objective consistently instead of changing what counts as activation between releases.
Funnel step conversion
Distinct users completing the next defined step divided by those eligible at the previous step, respecting order and timing rules.
Locate where a journey changes while avoiding ratios built from unrelated event totals.
Feature adoption
Distinct users completing the intended feature interaction divided by a stated eligible or exposed population.
Separate reach from the response to an experience, and identify which denominator fits the decision.
Cohort retention
The share of a fixed entry cohort returning for defined activity in an agreed later period.
Compare continued use after every cohort has had equal observation time; describe observational differences without assuming causality.
Task completion
Successfully completed tasks divided by valid attempts, with retries, abandoned attempts and asynchronous outcomes handled explicitly.
Connect product friction to an operational result such as a completed payment or successful game launch.
Experiment difference
The treatment-control difference on the agreed metric, reported in absolute and, where useful, relative terms.
Read the estimate alongside uncertainty, assignment validity and guardrails before deciding whether a change is useful.
Make it part of the week
Build the learning loop before the next release.
A better readout starts before shipping. Make the question, events and comparison explicit while the product team can still influence how they will be recorded.
Define the decision
Choose the journey or feature outcome, population and observation period. For an experiment, agree the primary metric, assignment unit and evaluation method before launch.
Connect the evidence
Map product events, version metadata and operational records. Validate the event sequence and identities on known cases, including retries, partial journeys and delayed outcomes.
Build the release view
Use drag-and-drop Dashboards for the launch readout and Master Chart for breakdowns. Save reusable Attributes and Segments while retaining fixed cohorts for historical comparisons.
Record what the analysis supports
Use Reports to share the result, its scope and the next question. Your team decides what to change; the next measurement should check the chosen outcome under comparable conditions.
Subscribe to Dashboards, download PDFs and deliver configured reports or notifications to email, Slack, Telegram, Google Chat or Microsoft Teams. Keep the review in the tools your team already uses.
Choose how the analysis starts
Ask. Keep checking.
Discover what deserves a closer look.
The same governed data supports different ways of working. Your team reviews the evidence and decides what happens next.
You ask
AI Agent
Explore a release or journey through follow-up questions using connected data and governed definitions. Ask for narrower cohorts and inspect the evidence behind the answer.
Where did first-deposit conversion change for Android users? Break the journey down by version, payment method and acquisition cohort.Explore AI Agent
You define the check
Insight Radar
Repeat a defined product investigation on your schedule. Specify the metric, mature observation window and comparison so recurring results remain interpretable.
Review seven-day activation for completed registration cohorts each morning and compare the main devices and markets.Explore Insight Radar
It investigates
Autonomous Agent
The agent chooses analytical threads across connected product and business data. Its findings can expose relationships the team had not included in the release checklist.
A finding about changing activity can lead to a conversation about feature exposure, player tenure and transaction outcomes. The relationship still needs interpretation.Explore Autonomous Agent
Connect the right context
Connect what players did with what the systems recorded.
Product analysis depends on the events you instrument and the operational records you connect. Gamblitude provides the shared analytical foundation; the integration should preserve the context needed to reconstruct the journey and evaluate the question.
Sources to bring together
- Product interaction events, including event time, user or session identifiers and relevant properties.
- Feature eligibility, recorded exposure, application version and release metadata.
- Experiment assignment, variant, assignment time and agreed evaluation records from your experimentation process.
- Player, verification, payment, game and betting records relevant to the chosen product journey.
- Available acquisition and campaign context for understanding changes in the population using the product.
Checks that make the analysis useful
- Resolve anonymous-to-account identity carefully and avoid counting one user as several people across devices.
- Version event definitions and validate instrumentation changes before comparing releases.
- Preserve event order and distinguish occurrence time from arrival time; deduplicate retries and repeated delivery.
- Keep assignment and fixed cohort membership historically stable, with incomplete observation windows clearly identified.
Before you begin
Practical questions.
Clear answers.
What product teams need to know about the data, the workflow and the available tools.
What is iGaming product analytics?
It examines player journeys, feature discovery, use and retention in the context of an iGaming operation. Connecting product events with account, payment and gaming records helps teams understand what happened across the experience rather than judging a feature from clicks alone.
Can we build funnels from our existing event data?
Yes, when the required events, identities and timestamps are available and modelled for the agreed journey. Define event order, repeated attempts and completion windows first. Governed Metrics and cohort breakdowns can then support consistent analysis of the resulting stages.
Does Gamblitude automatically collect every product interaction?
The analysis uses sources connected during implementation. Your product instrumentation determines which interactions and exposures are recorded. A game transaction can confirm play, for example, but cannot establish that a particular lobby position was seen without relevant tracking.
Can we analyse A/B experiments?
Connected assignment and outcome data can support experiment readouts on shared Metrics. The experiment design, randomisation, uncertainty calculation and stopping rules need an agreed method. Governed definitions improve consistency; they do not by themselves make an experiment valid or statistically conclusive.
Does higher retention among feature users prove the feature works?
No. More engaged users may be more likely to discover and use the feature in the first place. Compare eligibility, exposure and prior behaviour, then use a valid controlled design when you need to estimate the effect of the feature itself.
Can product teams inspect individual player journeys?
Configurable Player Profiles can combine available activity, payments, acquisition, CRM and product context in one place. The detail follows your connected data and permissions. Use individual histories to investigate mechanisms, then check how widely the pattern applies before prioritising a change.
Can we use personalised game or event recommendations?
Content Recommendations is an individually scoped implementation for a defined placement and eligible catalogue. Your team agrees the audience, ranking approach, delivery and fallback. Evaluate the experience with recorded exposure and a comparable control, keeping access and player-protection requirements in the implementation.
How should we start if our tracking is incomplete?
Choose one important journey and inventory the events and operational outcomes already available. Reconcile known cases, identify missing stages and agree the next instrumentation work. A clearly bounded first analysis is more useful than assigning precise conversion rates to events that were never recorded.
See it with your team
Bring the release
you want to understand.
Choose a journey, feature or experiment your team is reviewing. We will walk through the analytical approach with demo data and discuss the events, definitions and comparison needed for your own readout.