Solutions · Sportsbook Trading & Risk Management
Understand the result.
See what is still at risk.
Sportsbook analytics for the questions behind margin, exposure and betting behaviour.
A weak weekend margin, concentrated open positions and a settlement correction require different investigations. Gamblitude brings the relevant betting history, shared Metrics and AI analysis together, so your desk can examine each question at the right level: sport, league, event, market, bet type or player.
A clearer view of the book
One headline.
Several possible explanations.
Sportsbook trading analytics connects betting activity with realised financial outcomes and the positions that remain open. Its value is in separating those views before comparing them. A change in hold may reflect event results, a different mix of bets, cash-outs or corrections. More accepted stakes may sit in unsettled events. Gamblitude helps your team trace the movement through consistent definitions and connected records, then take the supporting evidence into its trading and risk processes.
Explain margin at the right depth
Compare settled GGR and stakes across leagues, markets, bet types and periods. Open the drivers behind an aggregate movement, including the effect of a few large payouts and changes in the mix of activity.
Keep open positions in view
Bring source-provided exposure snapshots into the same analytical environment. Examine concentration by event and outcome, with the snapshot time visible, while retaining a separate view of the revenue already settled.
Make investigations reproducible
Use governed Metrics for the recurring desk review, Attributes for player context and Reports for the handover. Trading, risk and finance can inspect the same underlying scope when they discuss a movement.
Inside the platform
Keep the reporting period and target in view.
Targets and analytical views help your team compare actual results with the agreed benchmark, then investigate the drivers in Master Chart.
Explore the BI platform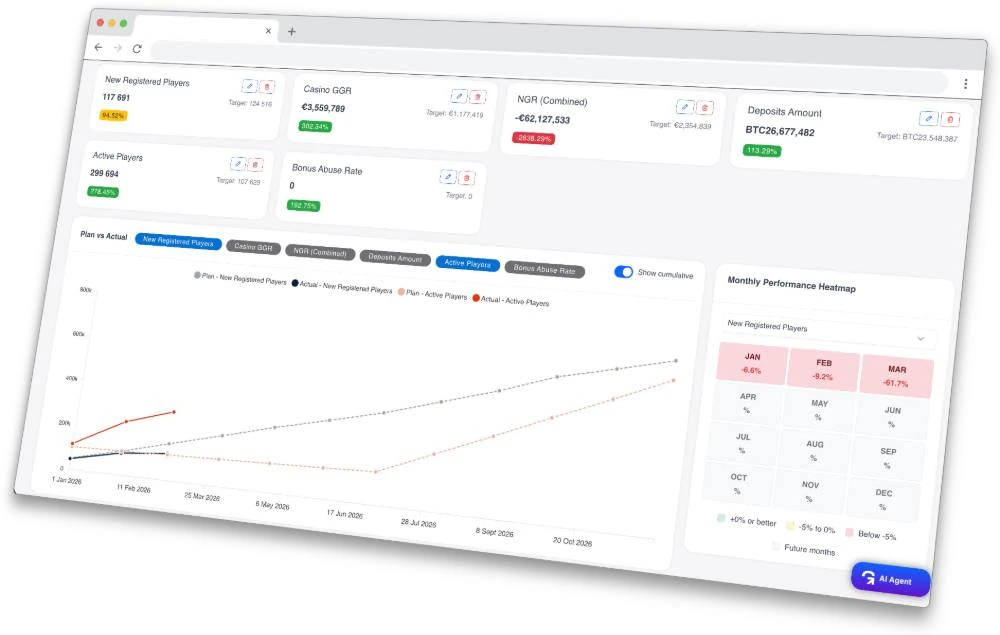
Four practical examples
From the first question
to a useful next step.
Explore the analysis, the comparisons and the context behind a decision. These are illustrative workflows, not customer results or preconfigured reports.
01 / Margin review
Did performance change, or did the mix change?
Why did settled hold fall when total stakes stayed the same?
The weekly headline is down, but a lower blended hold does not establish that every market deteriorated. Start with the same settlement period and inspect the composition of the book.
- Break settled stakes and GGR down by league and bet type, retaining void and cash-out treatment in the definition.
- Compare each group's hold and share of stakes. Identify whether the overall movement comes from mix, within-group results or both.
- Review the events and largest payout contributions behind material changes before the desk considers a pricing or product response.
Focus on the groups explaining the movement, then examine a longer comparable history.
02 / Open positions
Where is the next result most concentrated?
Which event outcomes account for the largest potential payout in the latest snapshot?
An event attracts a growing share of the book. Accepted stakes show demand; they do not, by themselves, describe the outcome-specific position your risk team needs to review.
- Start from the source's outcome-level exposure calculation and its timestamp. Keep open, settled and cancelled bets separate.
- Compare concentration within each event, then inspect market, bet type and linked bet context where the source supports it.
- Distinguish gross potential payout from net liability. Follow the source's treatment of returned stakes, offsets and accumulator dependencies.
Give the risk desk a focused position to review in its trading system against its own controls.
03 / Settlement review
Separate a correction from a new trading result
Why did last week's reported GGR change after the review was shared?
A settled event is corrected after the original report. Without a consistent update policy, the desk can mistake a historical adjustment for a fresh deterioration in current performance.
- Trace the changed settlement records to their event, original reporting period and correction timestamp.
- Compare the earlier and current settlement state. Separate payout changes, voids and cash-outs before explaining the total movement.
- Apply the agreed restatement policy consistently in the trading view and the financial reconciliation, with the source records available for review.
Explain the adjustment in the handover and reconcile it with finance before drawing a new performance conclusion.
04 / Player contribution
Find the activity behind a higher average stake
Did the typical player stake more, or did activity become more concentrated?
Accepted stakes rise while the number of active players falls. The average is useful, but it cannot reveal whether broad behaviour changed or a small group accounts for the movement.
- Use the same accepted-bet window to calculate stakes and distinct active players, then compare the resulting average.
- Examine medians, distribution bands and the share of stakes contributed by the largest accounts. Keep new and returning player cohorts visible.
- Open relevant Player Profiles to inspect betting history and event preferences, then compare the finding with settled outcomes separately.
Investigate the contributors before attributing the change to a healthier book, customer loss or a player type.
Agree the definitions
Define the number before judging the movement.
Build the desk's review from Metrics whose period, population, currency and settlement rules are explicit. The useful comparison is often between two related measures, rather than one KPI in isolation.
Accepted stakes
Stake value accepted during the chosen activity window, with rejected and cancelled bets treated explicitly.
Understand demand and betting mix without presenting unsettled volume as settled revenue.
Settled GGR
Settled stakes less the associated payouts under the agreed rules for voids, cash-outs and corrections.
Trace realised performance to events and reconcile adjustments with the financial view.
Settled hold
Settled GGR divided by corresponding settled stakes. Aggregate using total amounts, not an unweighted average of market percentages.
Compare performance across matched groups and separate mix changes from within-group movements.
Open exposure
The source's conditional position for unresolved outcomes, retaining its payout or liability definition and snapshot time.
Review event concentration without adding mutually exclusive outcomes or mixing open positions into GGR.
Stake concentration
The proportion of accepted stakes represented by a defined account group, event or market in the same period.
Test whether a headline change is broadly distributed or depends on a narrow part of the book.
Settlement adjustments
The difference between recorded settlement states, attributed according to the agreed restatement policy.
Explain why historical totals changed and keep corrections separate from new activity.
Make it part of the week
A desk review with a clear path to the detail.
Configure the first view around how your team hands over the book: what settled, what remains open, what changed and what deserves investigation. Each step should leave the next reviewer with a narrower question.
Start with the desk's definitions
Agree accepted and settled scopes, payout treatment, currency conversion and reporting cut-offs. Match a sample of events to source totals before using the comparison in routine reviews.
Build the daily view
Arrange drag-and-drop Dashboards around settled performance, activity mix and separately labelled open exposure. Use Targets for agreed performance comparisons where the metric and period are comparable.
Follow material changes
Use Master Chart to inspect leagues, markets and player cohorts. Schedule specific investigations with Insight Radar and retain the source update context when sharing a finding.
Hand over the evidence
Prepare Reports with the relevant comparison, contributing events and remaining questions. The trading and risk teams assess the evidence and carry out any operational changes in their systems.
Subscribe to Dashboards, download PDFs and deliver configured reports or notifications to email, Slack, Telegram, Google Chat or Microsoft Teams. Keep the review in the tools your team already uses.
Choose how the analysis starts
Ask. Keep checking.
Discover what deserves a closer look.
The same governed data supports different ways of working. Your team reviews the evidence and decides what happens next.
You ask
AI Agent
Start with the changed KPI, then ask for narrower breakdowns against the same governed definition. Check the comparison window and supporting numbers as the conversation develops.
Compare settled hold with the previous four comparable weeks. Which leagues explain the movement, and how much changed because of bet-type mix?Explore AI Agent
You define the check
Insight Radar
Repeat a desk question on an agreed schedule. Define the population, period and output so the recurring review stays relevant as events and activity change.
Review yesterday's settlement adjustments by event and identify the largest contributions to restated GGR.Explore Insight Radar
It investigates
Autonomous Agent
The agent selects investigative threads across connected business data and develops findings worth reviewing. A discovered relationship becomes a starting point for the desk's analysis.
A finding about changing player activity can lead to an investigation of league preferences, stake concentration and settled performance.Explore Autonomous Agent
Connect the right context
Connect the betting lifecycle, not just its final total.
The useful analytical depth follows the history your systems provide. Define the first use case around available records and a refresh schedule that fits the decision. Exposure analysis requires suitable position data; a settlement-only feed cannot describe the current open book.
Sources to bring together
- Accepted bets and bet legs, with event, market, selection, odds, stake and acceptance timestamps.
- Settlement, void, cash-out and correction records with stable identifiers and status history.
- Source-provided exposure snapshots, including calculation meaning, outcome scope and capture time.
- Player and account records with permitted attributes, activity history and brand context.
- Event and competition metadata, plus relevant bonus or acquisition context for scoped comparisons.
Checks that make the analysis useful
- Keep acceptance time, event time, settlement time and ingestion time distinct.
- Avoid duplicating the full stake across accumulator legs or summing incompatible outcome positions.
- Reconcile status changes and currency treatment before comparing desk and finance totals.
- Show feed coverage and freshness; retain missing values as missing rather than treating them as zero exposure.
Before you begin
Practical questions.
Clear answers.
What sportsbook trading & risk management teams need to know about the data, the workflow and the available tools.
What is sportsbook trading analytics?
It is the analysis of betting activity, realised results and available open-position data to support trading and risk decisions. Useful views connect the headline to leagues, events, markets, bet types and player groups while keeping their financial and time definitions consistent.
Does Gamblitude set odds or change player limits?
Gamblitude provides analytics and investigations. The trading desk decides whether a finding warrants a change and executes it through its trading systems. The analytics described here do not include an odds engine or automatic changes to limits, markets or bet acceptance.
Can we monitor open exposure?
Yes, where suitable exposure data is connected and its meaning is agreed. The view depends on the source calculation, covered positions and refresh schedule. Review the timestamp and conditional outcome scope before using a snapshot in a time-sensitive decision.
Why can turnover and GGR tell different stories?
Accepted turnover measures activity during an acceptance window. Settled GGR measures the outcome of settled bets under the agreed reporting policy. Large upcoming events can increase accepted stakes before they produce any settled revenue; comparing the two without that distinction can mislead.
Can a margin change prove a pricing problem?
No. Short-term hold can move because of results, stake mix, concentration or settlement changes. Analytics helps identify which records and groups account for the change. Assess the relevant history and trading context before concluding that odds were mispriced.
Can unusual betting patterns identify manipulation?
Patterns can provide evidence for investigation when the necessary records are available. Similar timing or selections alone do not establish coordination, arbitrage or wrongdoing. The risk team reviews the context and uses its established investigation and escalation process.
Where do predictive models fit?
Predictive Models are individually scoped and quoted. The published Player GGR Prediction application estimates eligible sportsbook players' GGR over the next 30 days. It is not an event-outcome forecast, exposure engine, recommended stake or automatic basis for a player limit.
Can trading and finance use the same numbers?
They can share governed definitions and the underlying settlement history. Agree the reporting basis, correction policy, currencies and included costs first. GGR, NGR and contribution answer different questions, so a shared model should make those distinctions visible rather than collapse them.
See it with your team
Bring the question
behind your next desk review.
Show us how you review margin, settlement changes or open positions today. We will demonstrate the analytical workflow with demo data, then discuss the source coverage and definitions your team would need.