Solutions · Acquisition & Affiliates
iGaming acquisition analytics.
Know what the spend brings.
From channel performance to player context.
Compare paid media and affiliate partners through the funnel and into the cohort’s subsequent activity. Connect the data you have, keep attribution rules explicit and review cost alongside observed value before deciding where the next budget should go.
The acquisition view
A first deposit is a milestone.
Keep following the cohort.
Acquisition and affiliate analytics for an iGaming operator connects marketing inputs with registration, first deposits and subsequent player behaviour. Gamblitude brings spend, source attribution and operational records into a shared analytical model. It helps media buyers, affiliate managers and finance compare channels on the same basis, while preserving the distinction between an attributed outcome, observed player value and evidence that a campaign caused an additional result.
Compare the same stage of the journey.
Put spend, registrations, first-time depositors and repeat activity beside one another. Define the conversion window and which records belong to each source. A campaign that produces many registrations may face a deposit-stage problem; a lower-volume channel may simply have a different audience or a less mature cohort.
Judge quality at a comparable age.
Use fixed acquisition cohorts to compare day-30 or day-60 activity and observed revenue. Keep the same age window for each cohort instead of ranking a new partner against one with months of accumulated value. Separate deposits, revenue, incentives and acquisition costs so the comparison answers a clear commercial question.
Make partner reviews specific.
Combine partner attribution with the agreed cost records and downstream activity. Review results by operator brand, market, placement or sub-affiliate identifier where those fields exist. A conversation about conversion, repeat participation and contribution is more useful than a league table of referrals without the commercial terms behind it.
Inside the platform
Make channel comparisons on a common basis.
Use Master Chart to compare governed Metrics across the periods, cohorts and acquisition dimensions available in your data.
Explore the BI platform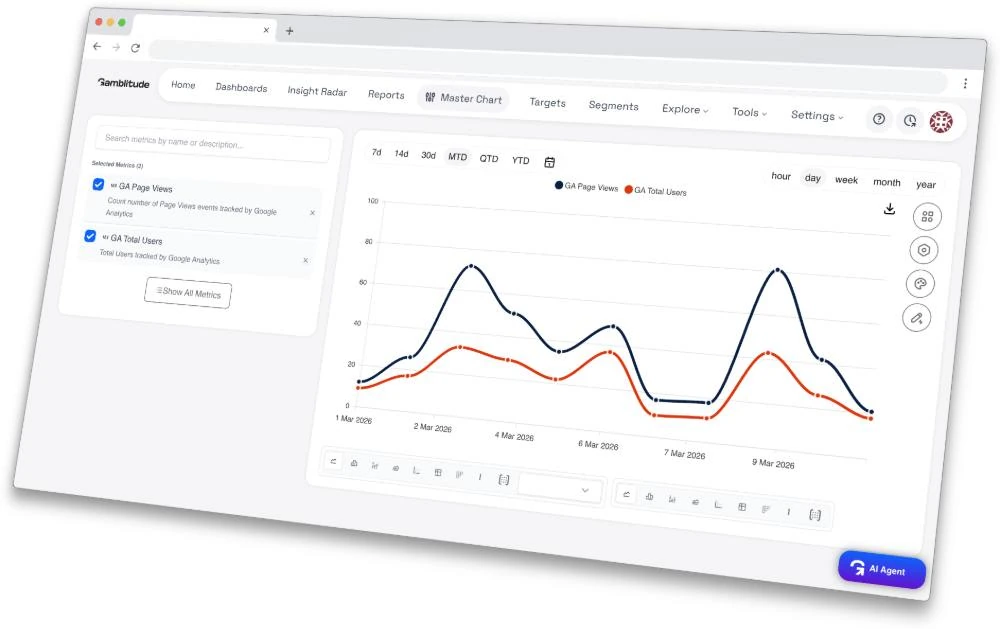
Four practical examples
From the first question
to a useful next step.
Explore the analysis, the comparisons and the context behind a decision. These are illustrative workflows, not customer results or preconfigured reports.
01 / Budget allocation
The lower CPA does not settle the decision.
Which acquisition cohort generated more observed value after media cost?
Two channels have different costs per first-time depositor. Before choosing the cheaper one, compare the same post-acquisition window and the activity behind its revenue.
- Create fixed FTD cohorts by source and acquisition period, with the full observation window available.
- Compare spend, FTDs and observed NGR under agreed deduction rules. Check concentration and product mix before interpreting averages.
- Review the result with the channel owner. Use a measured budget change or test to assess the next spending level.
Use CPA as one input to allocation, alongside cohort economics and the uncertainty around future performance.
02 / Affiliate review
More revenue can come with less contribution.
What remains after the partner costs included in this review?
The affiliate with the most revenue also costs more. Agree the contribution measure and cohort window before discussing placement, terms or additional volume.
- Join available partner identifiers with player attribution and commission records. Separate approved, provisional and disputed amounts.
- Compare NGR and partner costs over the same cohort window. Review repeat deposits, activity and player concentration.
- Inspect differences by market, brand or placement where available. Share assumptions and exceptions with affiliate management and finance.
Ground the partner conversation in the measured economics; contractual terms and the decision to change them remain with your team.
03 / Funnel investigation
Registrations held up. First deposits did not.
Where does the conversion difference become visible?
Registrations remain stable, but fewer new players deposit. Changing creative immediately could miss a payment, verification or tracking issue later in the journey.
- Use one registration cohort and a fixed conversion window. Compare campaign, landing page, market and device where available.
- Inspect verification and payment-attempt records. Check freshness and tracking changes before interpreting missing data as failed conversion.
- Review the narrowed question with product or operations. Agree the allocation, observation window and outcome before testing a change.
Focus the next test or operational review on the stage with evidence of friction, rather than attributing the whole decline to traffic quality.
04 / Attribution and coverage
Keep unattributed outcomes visible.
How much of the result can we confidently assign to a source?
Some first-time depositors have no usable campaign identifier. Excluding them can make the known channels look more representative than they are.
- Compare total qualifying FTDs with those assigned under the agreed attribution rule. Keep unmatched and ambiguous records in an explicit category.
- Check whether missing identifiers cluster around a device, market, redirect or acquisition route. Distinguish a tracking gap from genuinely direct or organic traffic.
- Document the rule used for partner and campaign reporting. Use the same rule for the period comparison, and review changes with the data and acquisition teams.
Improve the measurement basis before making a large allocation decision that depends on the missing share.
Agree the definitions
A scorecard that connects cost, conversion and cohort quality.
Make each measure answer a distinct question. Reuse the agreed definitions across media reviews, affiliate reporting and finance rather than treating every revenue-to-cost ratio as ROAS.
Cost per first-time depositor
Included acquisition spend divided by qualifying first-time depositors attributed under a stated rule and period.
Compare acquisition efficiency while keeping cost coverage and downstream player quality in view.
Registration-to-FTD conversion
The share of a registration cohort making a qualifying first deposit within a defined window.
Locate funnel differences without mixing mature registrations with players who have not had enough time to convert.
Observed cohort revenue
The chosen GGR or NGR measure accumulated during a fixed age window after acquisition.
Compare the realised value of equally mature cohorts; do not label a partial window as lifetime value.
Repeat-deposit rate
The share of qualifying first depositors making a subsequent successful deposit within the chosen window.
Examine continuing participation alongside revenue concentration, product mix and player activity.
Contribution after selected costs
Observed revenue less the explicitly included media, affiliate, incentive or payment costs.
Support commercial comparisons with the cost scope visible, rather than presenting an incomplete calculation as profit.
Attribution coverage
The proportion of relevant outcomes assigned under the chosen source-identification rule.
Show how much of the channel comparison rests on matched data and where measurement needs attention.
Make it part of the week
From a weekly channel review to a better next test.
Keep acquisition measurement connected to operating data and the decisions your team can make. A repeatable review should expose uncertainty as well as results.
Agree the measurement basis.
Choose the acquisition event, source hierarchy, conversion window and cost categories. Align on player and campaign identifiers with the data team. Decide how unmatched records, repeat accounts and provisional partner costs will appear, so exceptions remain visible rather than silently disappearing from the denominator.
Build comparable cohorts.
Use Segments and Attributes to define the source, market, brand and acquisition period. Keep completed observation windows separate from developing cohorts. Arrange a dashboard around the funnel and value measures, and use Master Chart when a result needs a more detailed comparison.
Investigate before reallocating.
Inspect the channels or partners with the largest changes. Review Player Profiles where individual history can explain concentration or an unusual journey. Ask AI Agent for a narrower breakdown, then decide whether the next step is a tracking fix, an operational investigation or a controlled marketing test.
Document and revisit.
Use Reports to record the comparison, proposed change and measurement plan. Set relevant Targets and a recurring Insight Radar review. When results arrive, distinguish the new observed outcome from the incremental effect of the change; the latter depends on a suitable evaluation design.
Subscribe to Dashboards, download PDFs and deliver configured reports or notifications to email, Slack, Telegram, Google Chat or Microsoft Teams. Keep the review in the tools your team already uses.
Choose how the analysis starts
Ask. Keep checking.
Discover what deserves a closer look.
The same governed data supports different ways of working. Your team reviews the evidence and decides what happens next.
You ask
AI Agent
Explore why a channel’s headline performance changed. Follow the funnel into a comparable cohort view and ask for the definitions behind the measures before drawing a commercial conclusion.
Why did first deposits fall for this source last week? Compare registrations and seven-day conversion by market and device, and show where source coverage differs.Explore AI Agent
You define the check
Insight Radar
Repeat the acquisition review your team has chosen. Specify the period, cohort maturity and dimensions that belong in the check, then review the returned findings alongside costs and source completeness.
Every Monday, compare completed day-30 cohorts by acquisition source: FTDs, repeat deposits, observed NGR and included acquisition cost. Highlight changes worth reviewing.Explore Insight Radar
It investigates
Autonomous Agent
Let the agent select and develop investigations across connected acquisition and operating data. Its finding may reveal an unexpected relationship between traffic, conversion and later activity that your standing report did not ask about.
Example investigation: one source’s lower first-deposit count coincides with a device-specific conversion drop, while registrations remain broadly stable. Your team reviews the evidence and next step.Explore Autonomous Agent
Connect the right context
Connect the journey you can actually observe.
A useful acquisition model joins the available identifiers and makes unmatched data visible. Scope the sources around the channels and partner decisions you need to support.
Sources to bring together
- Paid-media spend, campaign and creative identifiers
- Affiliate referral and commercial cost records
- Registration, account and qualifying deposit events
- Product activity, bonuses and observed revenue
- Landing-page or product events where tracking is available
Checks that make the analysis useful
- Apply one explicit attribution rule to each comparison.
- Keep acquisition dates and cohort observation windows consistent.
- Separate settled cost records from estimates, disputes and missing periods.
- Measure identifier coverage; do not infer person-level attribution from aggregate traffic reports.
Before you begin
Practical questions.
Clear answers.
What acquisition & affiliates teams need to know about the data, the workflow and the available tools.
Who is this acquisition and affiliate view for?
It is for an iGaming operator’s paid-media, acquisition and affiliate-management teams, working with finance and data colleagues. It connects marketing and partner inputs to available player outcomes. A publisher or affiliate business has a different reporting perspective, covered on the dedicated Affiliates vertical page.
Can we follow players from acquisition into later activity?
Yes, where source identifiers can be linked to the relevant account and activity records. You can analyse registration, deposits, product use and observed revenue together. The available journey depends on tracking coverage and the agreed attribution rule; unmatched records should remain visible in the analysis.
Does Gamblitude supply a universal attribution model?
The analytical model can use the attribution fields and rules agreed for your operation. It does not make every click, device or anonymous visit identifiable. Compare results using a documented rule, and distinguish attributed outcomes from causal marketing impact. Changing the attribution rule can change a channel ranking without changing the underlying business.
How should we compare a new affiliate with an established one?
Use equally mature cohorts and the same outcome window, such as the first 30 days after a qualifying deposit. Compare volume, continuing activity, observed revenue and the relevant partner costs. A new cohort’s partial history should not be ranked directly against an established cohort’s accumulated value.
Can we report on CPA, revenue-share and hybrid agreements?
You can analyse the commercial terms and cost records available from your systems alongside attributed outcomes. Keep the included fees, adjustments and approval status explicit. The agreed calculation supports partner review; it does not replace the contract, payout approval or affiliate platform responsible for settlement.
Can Predictive Models help before a cohort matures?
Selected models can add another signal, with a separate scope and quote. Early VIP Detection supports agreed high-value criteria, and Player Churn Prediction assesses an agreed disengagement outcome. Player GGR Prediction currently estimates the next 30 days of GGR for eligible sportsbook players; it is not universal cross-product lifetime value or a channel-spend optimiser.
How do we know whether a campaign caused incremental value?
Use a suitable controlled test or other credible evaluation design, with the comparison population, exposure and outcome window defined in advance. Observed revenue after a campaign is not automatically additional revenue caused by it. Gamblitude can bring the relevant campaign and outcome records into the analysis; the measurement design remains essential.
What is a useful first acquisition use case?
Choose a channel or partner decision that is currently difficult to explain. Bring the spend or commission data, source identifiers, registration and deposit records, and the intended comparison window. We can demonstrate a relevant workflow with demo data and then assess how your available sources support that question.
See it with your team
Bring the channel question.
Look beyond the headline CPA.
We will show a relevant acquisition investigation using demo data, then discuss your attribution, cohort windows, source systems and the decisions behind your next media or partner review.