Solutions · Data, Analytics & BI
Define it well.
Put it to work.
Give the business useful answers on a foundation your data team can govern.
Connect operational sources, agree the meaning of Metrics and enable repeatable analysis through Dashboards, Master Chart, Segments, Reports and AI. Make definitions reusable while keeping the evidence behind each result accessible.
A common analytical model
Govern the meaning.
Enable the next question.
An iGaming semantic layer defines business measures and reusable Attributes above connected source data. It gives teams a common basis for analysis: what qualifies as activity, how revenue is calculated and which population a comparison covers. Gamblitude combines that governed layer with a managed data warehouse and visual analytical tools, so the data team can turn repeated requests into capabilities other teams can use.
Make the definition inspectable
Agree formulas, qualifying events, filters and business ownership for important Metrics. Document time zones, currencies and exclusions alongside the calculation. A shared name is useful only when people understand the scope behind it.
Build reusable analytical paths
Turn recurring questions into a Dashboard, reusable Attribute, Segment or Report. Let stakeholders explore supported dimensions through visual tools while keeping specialist calculations, new sources and unfamiliar interpretations with the appropriate data owner.
Connect AI and models to the same context
Give AI analysis governed definitions and available evidence. For predictive work, add an explicit target, eligible population, scoring date and outcome window. Consistent inputs help review; they do not make every answer or prediction correct.
Inside the platform
Definitions the whole platform can use.
Metrics, Attributes and permissions give teams a common analytical foundation. Manage definitions centrally while making the right views available to each role.
Explore the BI platform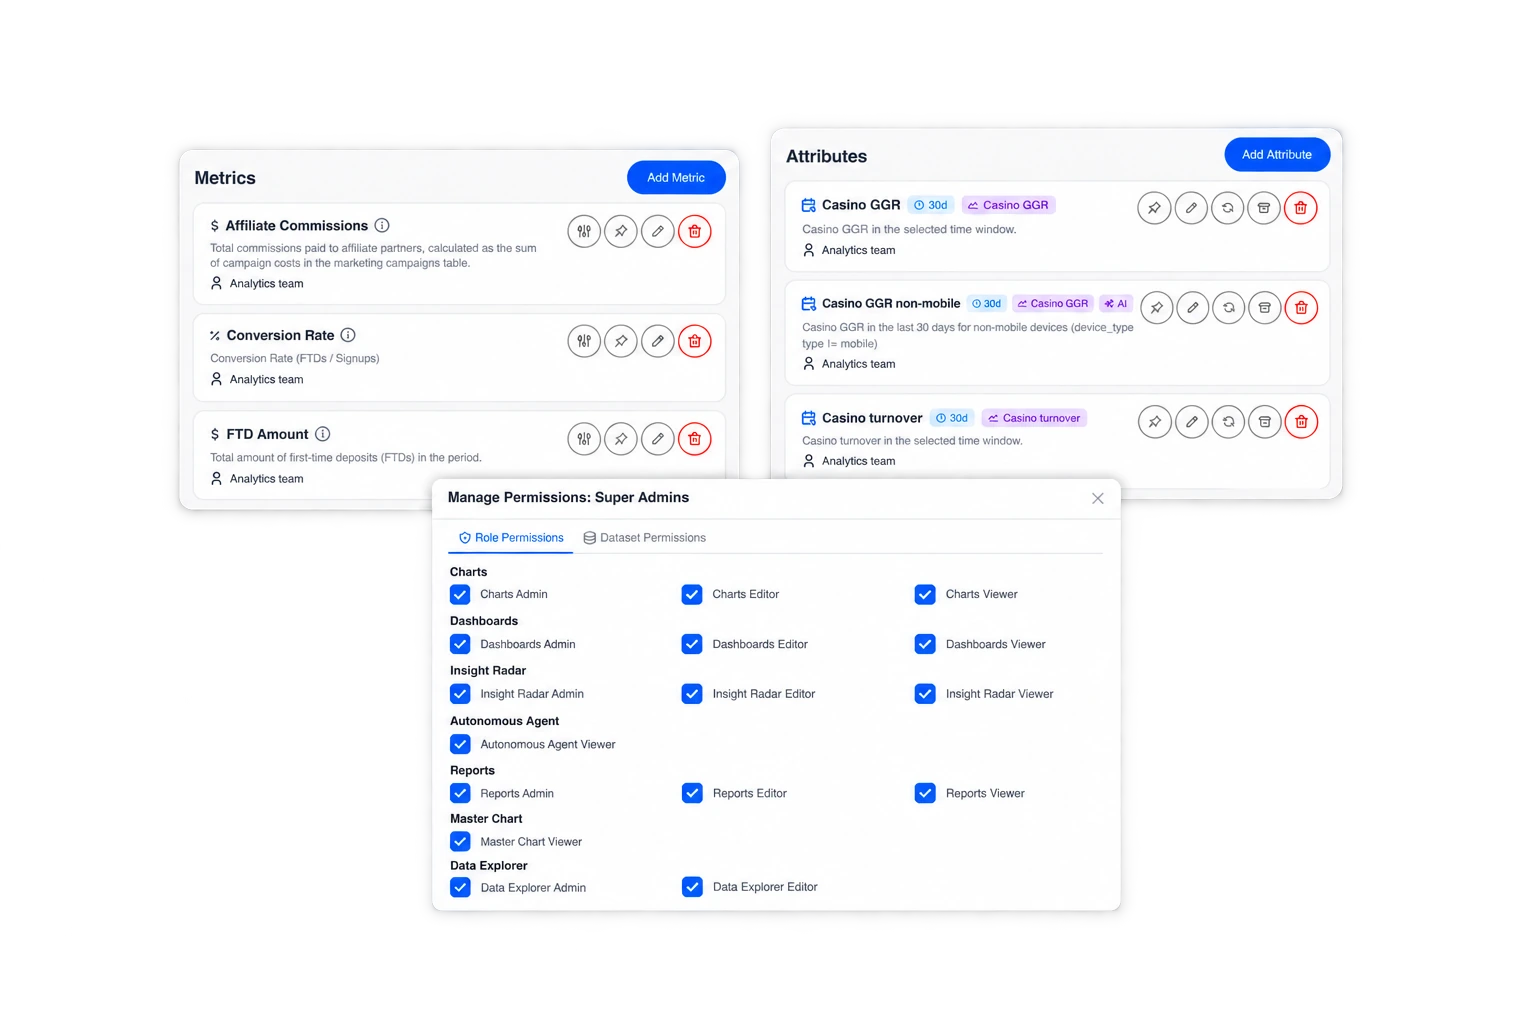
Four practical examples
From the first question
to a useful next step.
Explore the analysis, the comparisons and the context behind a decision. These are illustrative workflows, not customer results or preconfigured reports.
01 / Metric disagreement
Explain why two revenue views differ
Are the teams comparing different calculations, populations or cut-offs?
Two departments bring different net-revenue numbers to a meeting. Compare definitions, included costs, transaction states and reporting periods before replacing a dashboard.
- Start with the gross measure and reconcile it against source records for the same product, currency and event period.
- List the adjustments included in each view. Agree which costs belong in the analytical Metric and how late postings or reversals are treated.
- Publish the agreed Metric and reuse it across Dashboards, Reports and AI. Keep the filters and comparison scope explicit when teams create their own views.
Give each view an unambiguous purpose and definition. An analytical revenue measure does not replace finance's ledger or statutory accounting treatment.
02 / Repeated cohort request
Turn retention questions into a reusable view
Can CRM compare the same cohort without redefining active players each time?
CRM repeatedly requests retention by market, source and product. The reusable asset is a defined cohort and activity rule, rather than another isolated spreadsheet.
- Define the entry event and fixed cohort population. Agree what counts as activity and whether follow-up uses relative days or calendar periods.
- Create the relevant Attributes and Segment, then build a Dashboard or Master Chart view for supported breakdowns. Keep incomplete follow-up windows identifiable.
- Validate a sample against activity records. Activity in week two differs from activity at any point since registration.
Enable stakeholders to explore the agreed question independently and bring new definition requests back to the data owner.
03 / Unexpected decline
Check source coverage before explaining performance
Is the business result lower, or is part of the input still missing?
A morning dashboard shows a payment decline after a source-delivery change. Before interpreting player behaviour, check whether the periods contain equivalent data.
- Compare source control totals with received records for the agreed extract window, where those control totals are available.
- Review late records, duplicate events, unmapped statuses and time-zone boundaries. Identify the latest complete period rather than relying only on the dashboard refresh time.
- Reconcile a sample of transaction IDs and repeat the business comparison on consistent coverage. Capture the issue and follow-up in the team's data process.
Resolve ingestion or mapping issues before explaining performance. Label remaining gaps and avoid presenting an incomplete period as a complete comparison.
04 / Predictive implementation
Make a forecast usable and testable
Who received a prediction, when was it made and which outcome should it match?
The team wants to use Player GGR Prediction in analysis. The published model estimates eligible sportsbook players' GGR over the next 30 days; it is not a generic all-product lifetime-value field.
- Agree eligibility, historical data requirements and the GGR definition as part of the separately scoped model implementation.
- Retain the scoring date, outcome window and available prediction history. Distinguish ineligible players from missing scores.
- Evaluate forecasts after their outcome windows mature, using the same target definition. Review monetary error and ranking quality, and avoid using future information in historical inputs.
Expose the agreed prediction through Attributes, Segments or Dashboards with its meaning intact. Operational use needs its own rules and evaluation.
Agree the definitions
Define quality alongside business performance
Useful governance combines clear business measures with checks on the records behind them. Agree which source controls or operational metadata are available before choosing the quality checks.
Reconciliation difference
The amount or count difference between a source control and the corresponding analytical scope at a stated cut-off.
Locate discrepancies by product, source or state before changing a business definition to force agreement.
Source completeness
Received eligible records divided by expected records for a defined extract or event window.
Identify incomplete comparisons when an authoritative expected count exists. Keep unmeasurable coverage explicit.
Data freshness
Elapsed time since the latest complete event period available from a source, using agreed completeness criteria.
Distinguish a refreshed chart from current underlying data and set expectations for each use case.
Unmatched identity rate
Records without a valid required entity link divided by records requiring that link.
Find attribution, player or transaction joins that could distort counts and downstream Segments.
Duplicate-event rate
Duplicate event records under the agreed business key divided by ingested records in the same scope.
Check replayed feeds and repeated notifications while preserving legitimate updates to an existing event.
Prediction coverage
Eligible entities with an available prediction at a scoring point divided by all eligible entities.
Separate model availability from model quality. Evaluate forecast error against matured outcomes independently.
Make it part of the week
Build from one decision to a reusable foundation
Choose a business question that recurs and define what a reliable answer requires. Expand the analytical model after the first source mappings, definitions and working views have been reviewed.
Agree the analytical contract
Name the decision, Metric owner, population, qualifying events and reporting period. Include currencies, time zones, exclusions and required dimensions. Identify which business terms currently mean different things to different teams.
Map and validate the sources
Agree integration methods, identifiers and historical scope. Reconcile representative periods and edge cases: cancelled transactions, late settlements, test accounts and changed statuses. Document coverage gaps before using them in a business comparison.
Enable the first users
Build a drag-and-drop Dashboard, reusable Segment or Report around the agreed question. Configure role and dataset permissions. Show users how to inspect definitions, adjust supported filters and recognise when a request needs specialist work.
Review changes and reuse
When a source or definition changes, review affected views, reports and AI questions. Compare representative outputs and communicate the new scope. Prioritise subsequent work by recurring business questions rather than copying every legacy report unchanged.
Subscribe to Dashboards, download PDFs and deliver configured reports or notifications to email, Slack, Telegram, Google Chat or Microsoft Teams. Keep the review in the tools your team already uses.
Choose how the analysis starts
Ask. Keep checking.
Discover what deserves a closer look.
The same governed data supports different ways of working. Your team reviews the evidence and decides what happens next.
You ask
AI Agent
Let a stakeholder investigate a question using governed Metrics, Attributes and the connected model. The data team provides the definitions and reviews unfamiliar calculations or interpretations rather than manually producing every variation of a familiar comparison.
Compare first-deposit conversion by acquisition source for complete weekly cohorts. Show the eligible registration count and explain the filters used in the conversion measure.Explore AI Agent
You define the check
Insight Radar
Make a recurring analytical question explicit: its scope, comparison window, schedule and expected output. Review the supporting evidence when a result changes, including whether source coverage or a definition changed alongside performance.
Each Monday, review retention for cohorts with complete follow-up. Compare the main markets, show the original cohort sizes and identify which periods remain incomplete.Explore Insight Radar
It investigates
Autonomous Agent
Develop investigations beyond a predefined stakeholder request. The agent selects threads in connected data and surfaces related findings. The data team can assess definitions and coverage while business owners evaluate relevance and decide what to do next.
An investigation connects a movement in first deposits with registration volume and conversion. Review the shared Metric definitions and supporting breakdowns before drawing a business conclusion.Explore Autonomous Agent
Connect the right context
Make source meaning part of the integration
A managed warehouse still needs a clear agreement about what its inputs mean. Data access, history, source behaviour and validation determine which analytical questions can be answered reliably.
Sources to bring together
- Platform, sportsbook and casino events, including relevant settlement, cancellation and correction states.
- Player and account records with stable identifiers and available historical changes.
- Payment, bonus and financial source records for agreed analytical measures.
- CRM, affiliate, paid-media and product-analytics data with the identifiers needed for valid joins.
- Source control totals, delivery metadata and model outputs where needed for the agreed quality and prediction views.
Checks that make the analysis useful
- Agree business keys and distinguish a duplicate event from a legitimate update or correction.
- Define event time, reporting time zone, currency conversion and late-arriving-record treatment.
- Document Metric formulas, filters, denominators, ownership and affected analytical uses when definitions change.
- Validate permissions, historical coverage and join completeness before exposing new data to users or AI workflows.
Before you begin
Practical questions.
Clear answers.
What data, analytics & bi teams need to know about the data, the workflow and the available tools.
What does the semantic layer do?
It gives connected records a reusable business meaning through governed Metrics and Attributes. A Metric defines a calculation and its filters; an Attribute describes a player or another business entity. Dashboards, Segments, Reports and AI can then work from those definitions while keeping the selected scope and period visible.
Will shared Metrics make every report show the same number?
They provide a common calculation, but results still depend on filters, periods, currencies and source coverage. Two valid views can answer different questions. A useful reconciliation checks those differences first, then investigates the records or definition rather than assuming either report is automatically wrong.
Can business teams work without writing SQL?
Everyday Dashboards, Master Chart analysis, Segments, Reports and Targets use visual tools, and AI Agent accepts plain-language questions. Dashboards support drag-and-drop editing. New source integration and specialised calculations still need technical governance; self-service means enabling well-defined questions, not removing the data team's expertise.
How does the managed warehouse fit our existing systems?
We review the sources and available access, then agree ingestion, modelling and validation. Supported approaches include APIs, secure file uploads, Kafka and cloud event streams, subject to the source and scope. The rollout defines historical coverage and freshness instead of assuming all systems share one update schedule.
How should we govern an AI answer?
Review the underlying Metric, filters, comparison window and supporting data. Check source coverage and whether the explanation goes beyond what the figures establish. Shared definitions make that review more practical, but the team still evaluates interpretation and decides whether further investigation is needed.
Can users access the data through ChatGPT or Claude?
Gamblitude's MCP Server lets enabled external AI tools query Metrics, Dashboards and insights. Existing user permissions apply, and a Settings Admin controls enablement. This is a separate access route from native AI Agent conversations, Insight Radar checks and report delivery through configured team channels.
Are predictive models part of every BI implementation?
Predictive Models are separately scoped and quoted. Each requires an agreed target, eligible population, historical data and evaluation plan. For example, Player GGR Prediction has a published sportsbook next-30-day scope; that does not imply universal lifetime value, all-product forecasts or automatic CRM actions.
What should we prioritise first?
Choose a recurring decision with identifiable sources and a definition that matters across teams. A revenue reconciliation or a reusable retention cohort is a useful starting point. Validate it with its business owner, build the working view and use that experience to prioritise the next sources and questions.
See it with your team
Bring the difficult definition.
Build the useful view.
Show us a disputed Metric or a recurring analytical request. We will map the sources, calculation and first reusable workflow with your data and business teams.